Tuesday 23 May 2023

Creating and Mastering GA4 Explorations

In the switch from Universal Analytics (UA) to Google Analytics 4 (GA4) — which will go fully into effect July 2023 — a lot of things have changed.

One such change that has majorly impacted website and application owners, managers, and marketers is how user behavior is monitored and reported.

UA’s “canned” reports (we say that lovingly) are all but gone. In their place is a powerful and fully-customizable editor for creating nearly endless user data reports.

But, as Spider-Man kinda-sorta said, with great power comes a great amount of learning.

So in this installment of our guides to getting the most out of GA4, we’re going to cover all things in GA4 Explorations.

Dive in to learn what the heck that means, take a guided tour of all the core pieces you need to know, and come out on the other side with your very first exploration.

What Are GA4 Explorations?

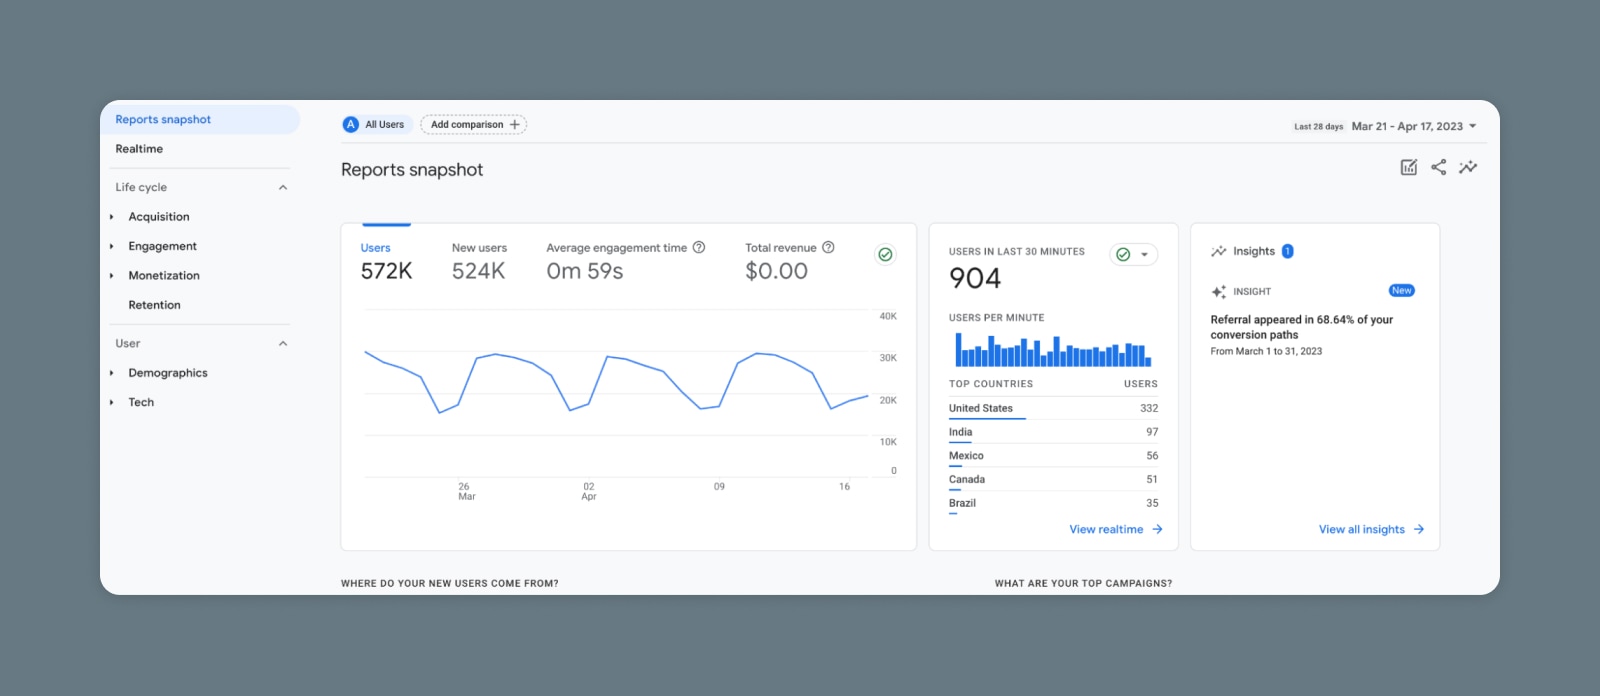
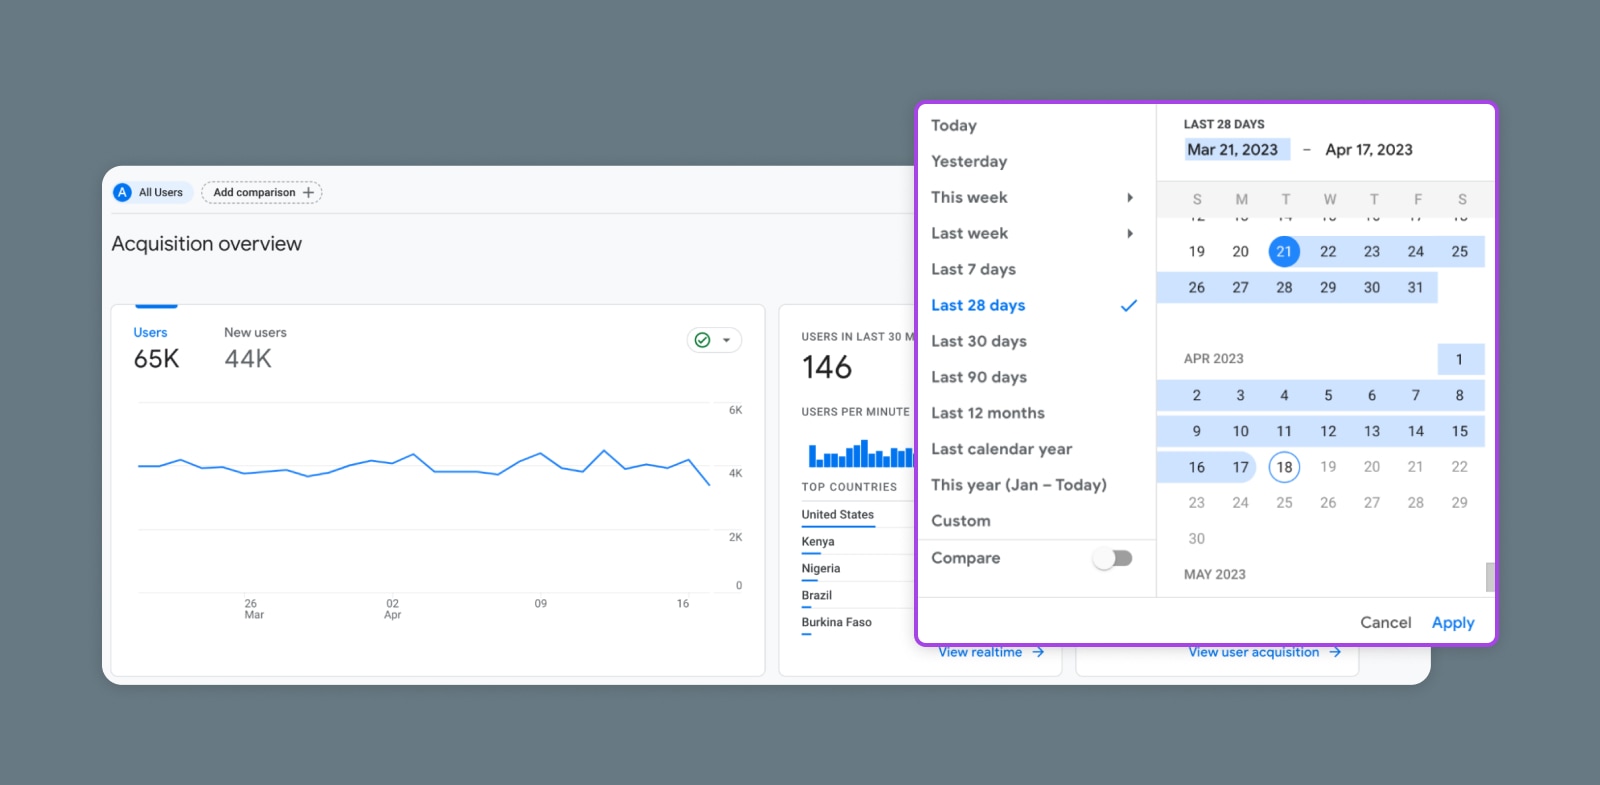
If you’ve had a chance to poke around in Google Analytics recently, you probably know GA4 still has what it calls “Standard reports,” which enable property owners to report on users, acquisition, engagement, monetization, and more.

DreamHost Glossary

Engagement Metric

‘Engagement metrics’ refer to any measure of user activity on a website. It can include clicks, views, comments, and more. This information is typically obtained using data tracking and analytics.

Read More

But we’re not here to talk about those today.

What we’re going to cover in this guide is something completely new and unique: GA4 Explorations.

Explorations are powerful charts that can be quickly built from the ground up and customized to view detailed visitor data (web and app) and uncover helpful insights about consumer behavior.

A note for the record before we move on, Google Analytics didn’t shake things up just for fun — Reporting (and many other capabilities) had to shift as Google Analytics’ data model changed to focus on events versus factors like sessions and pageviews that UA relied on. If you’re curious about this new data model, learn more from our guide to GA4 events.

Why is it Important to Master GA4 Explorations?

The fundamental benefit of Explorations in GA4 is flexibility.

While the predetermined reports provided by UA certainly can be customized, explorations are on a whole different level regarding personalization.

Along with several helpful graph templates to get you started, exploration fields make it easy to compare custom audience segments, cross-reference any data, analyze behavior over an entire user lifetime, uncover and study unknown user journeys, and almost anything else you can imagine.

GA4 Explorations doesn’t just stand out when dissecting data — it’s also extremely helpful at visualizing and making all that data interactive so you can actually understand what it’s showing you.

Another awesome feature of GA4 Explorations is its speed. Configure robust reports ad hoc, add and change filters, and share or export exploration reports with the click of a button and watch your charts update instantly.

In addition to all these benefits, the fact is that explorations are the new way to dive into data if you’re using Google Analytics. So if you’re going to continue to use the platform to understand and report on your web and application users — mastery is no longer a maybe; it’s a must.

With that in mind, let’s get to know the ins and outs of GA4 Explorations.

Get Content Delivered Straight to Your Inbox

Subscribe to our blog and receive great content just like this delivered straight to your inbox.

The Key Elements of GA4 Explorations

Not surprisingly, there are a lot of moving parts within GA4 Explorations. In this section, we’ll step through the main components you need to be familiar with to navigate the feature.

We highly recommend opening up your GA4 panel and following along to make this feature walkthrough as helpful as possible.

Explorations Main Page

First, if you’re not already using GA4, here’s how to update from Universal Analytics to GA4.

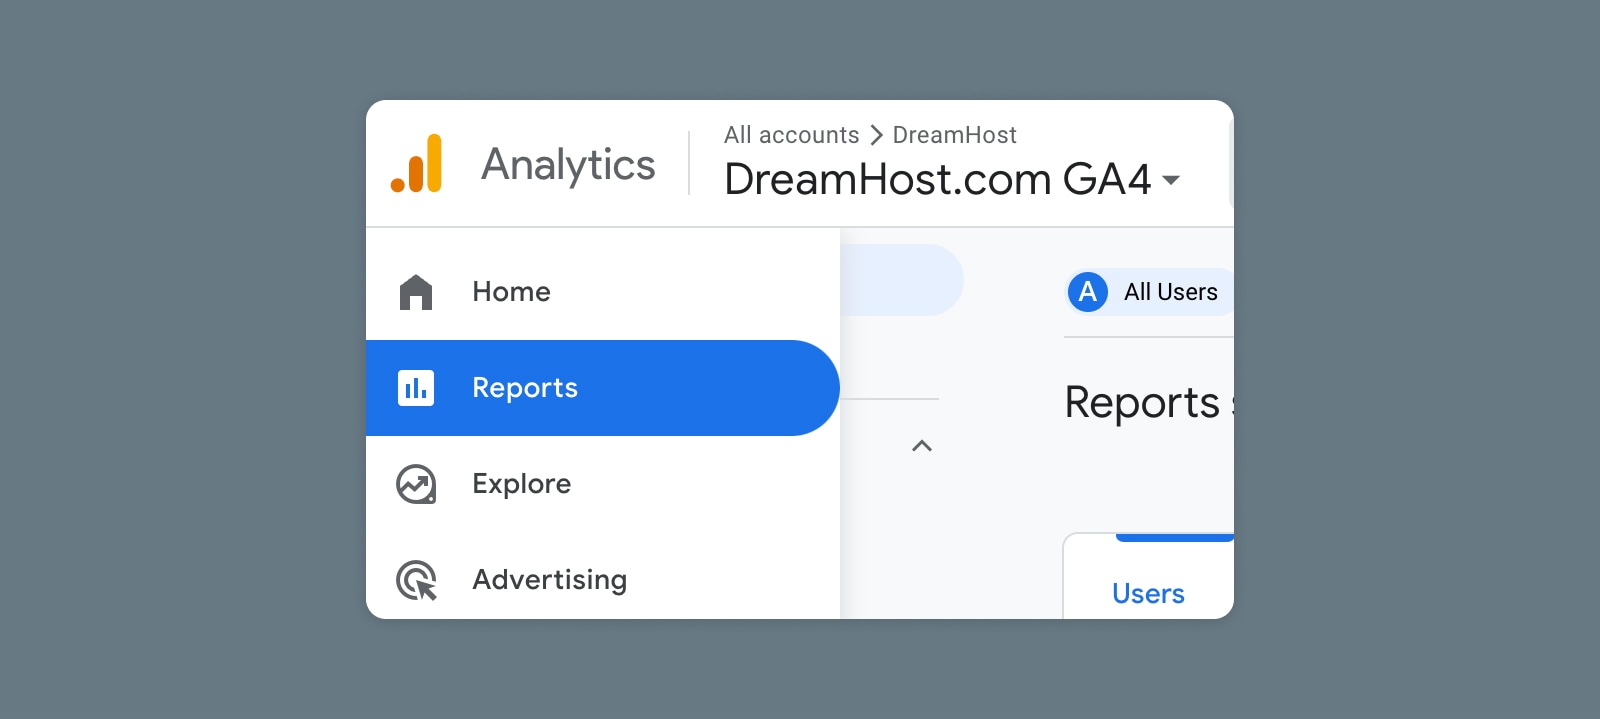
Once you’re signed into the latest instance of Google Analytics, choose the account and property or app for which you want to create an exploration. Do this using the dropdown menu in the upper left corner of the screen by the Analytics logo (on desktop).

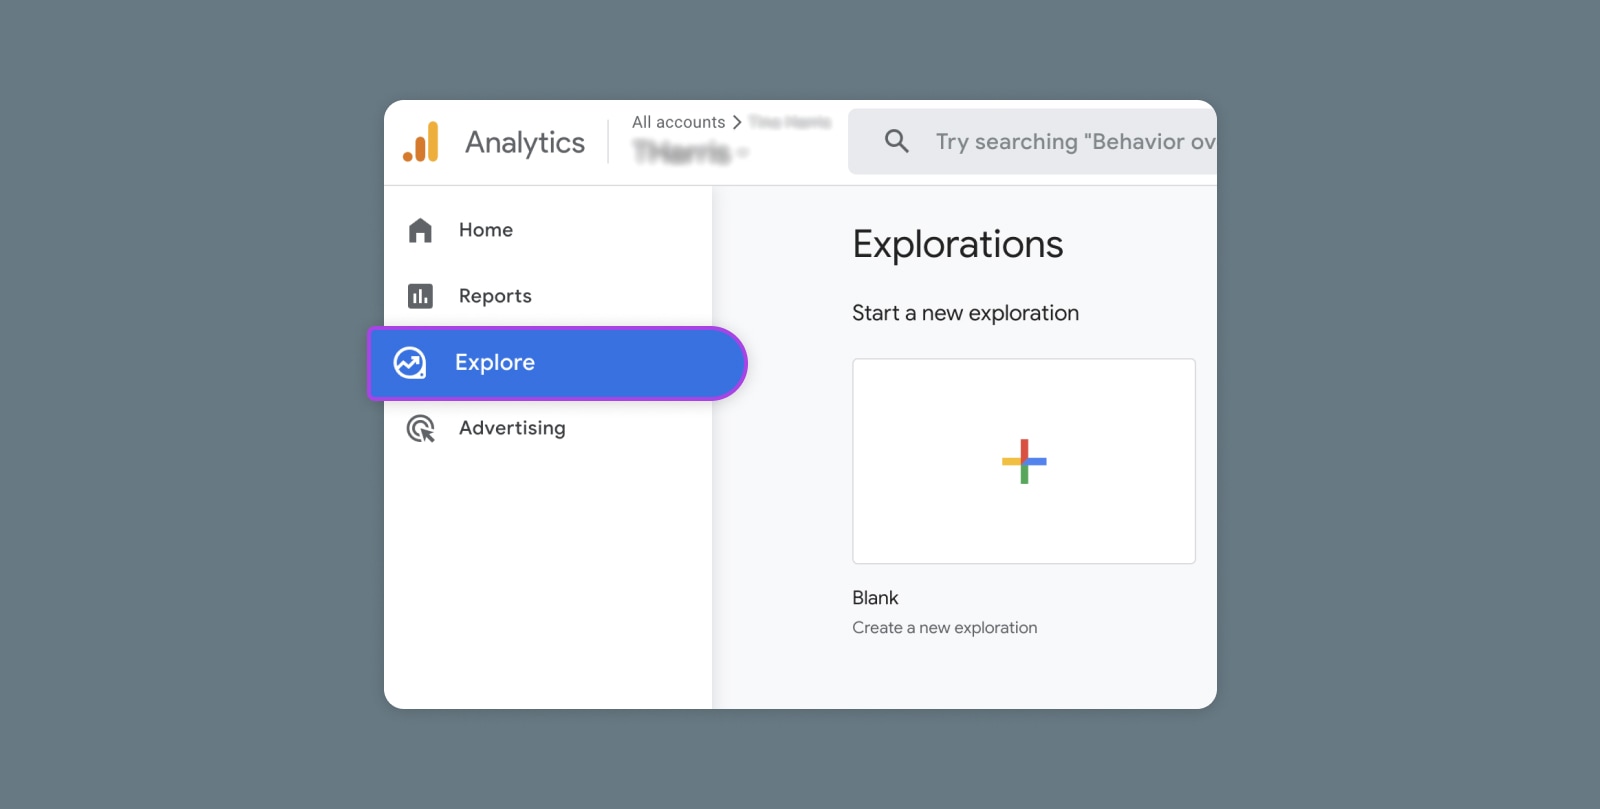
In the sidebar menu, select Explore — and you’re in!

GA4 Explorations Main Page

This is where you’ll choose to start with either a blank template or a “technique” for your exploration. (Click on “template gallery” to view templates built for specific use cases — such as acquisition — and industries — such as ecommerce and gaming.)

GA4 Start a new exploration

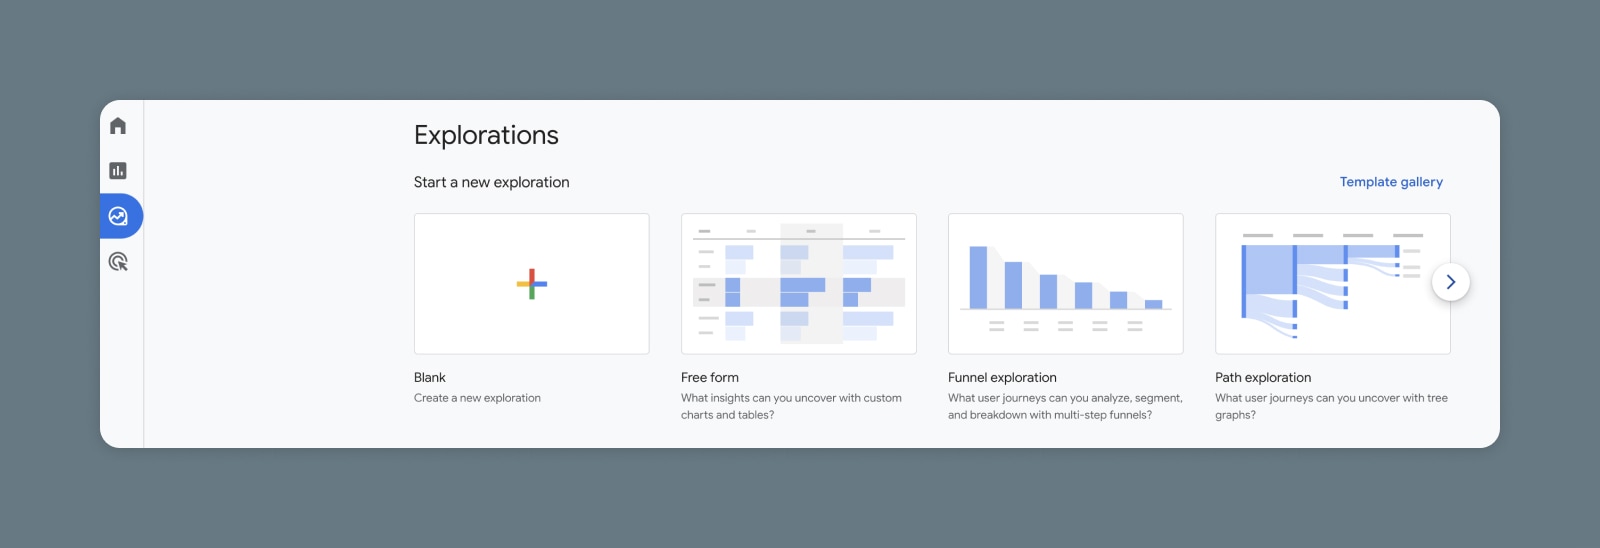
Techniques are types of visualizations. At the time of this writing, these are the techniques GA4 offers:

Free-Form Exploration

Free-form is almost like starting an exploration from scratch, but a little less daunting. Begin with a crosstab layout for displaying your data, then layer in other visualization elements of your choice such as geo maps, scatter plots, line charts, bar charts, and more.
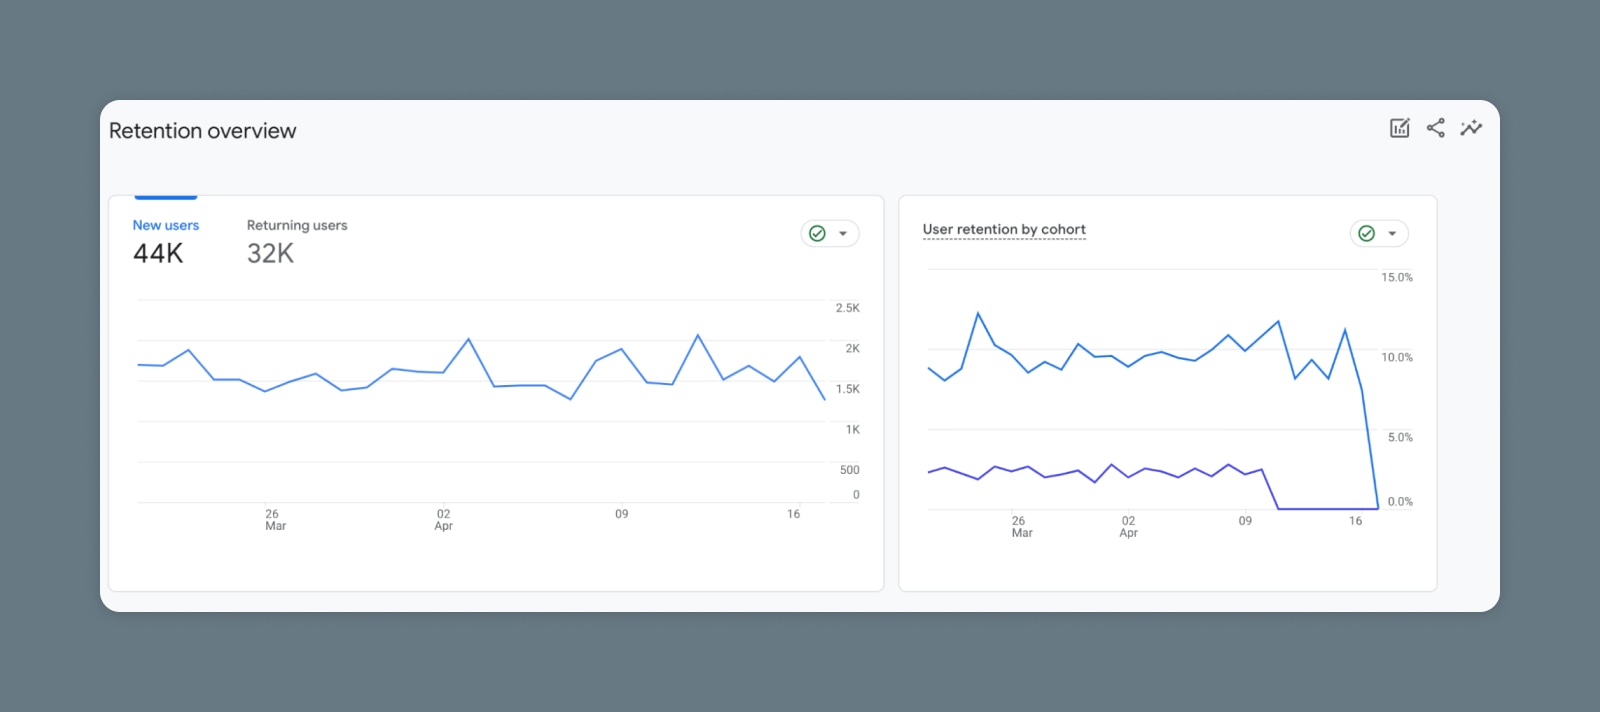
Cohort Exploration

Look at segments of users that share common attributes to gain a deeper understanding of their behaviors and patterns with a cohort exploration.

Funnel Exploration

Funnel exploration is especially helpful for visualizing the steps users take to complete specific conversions. By knowing this, you can better predict and focus on the key actions that lead to money-making conversions.
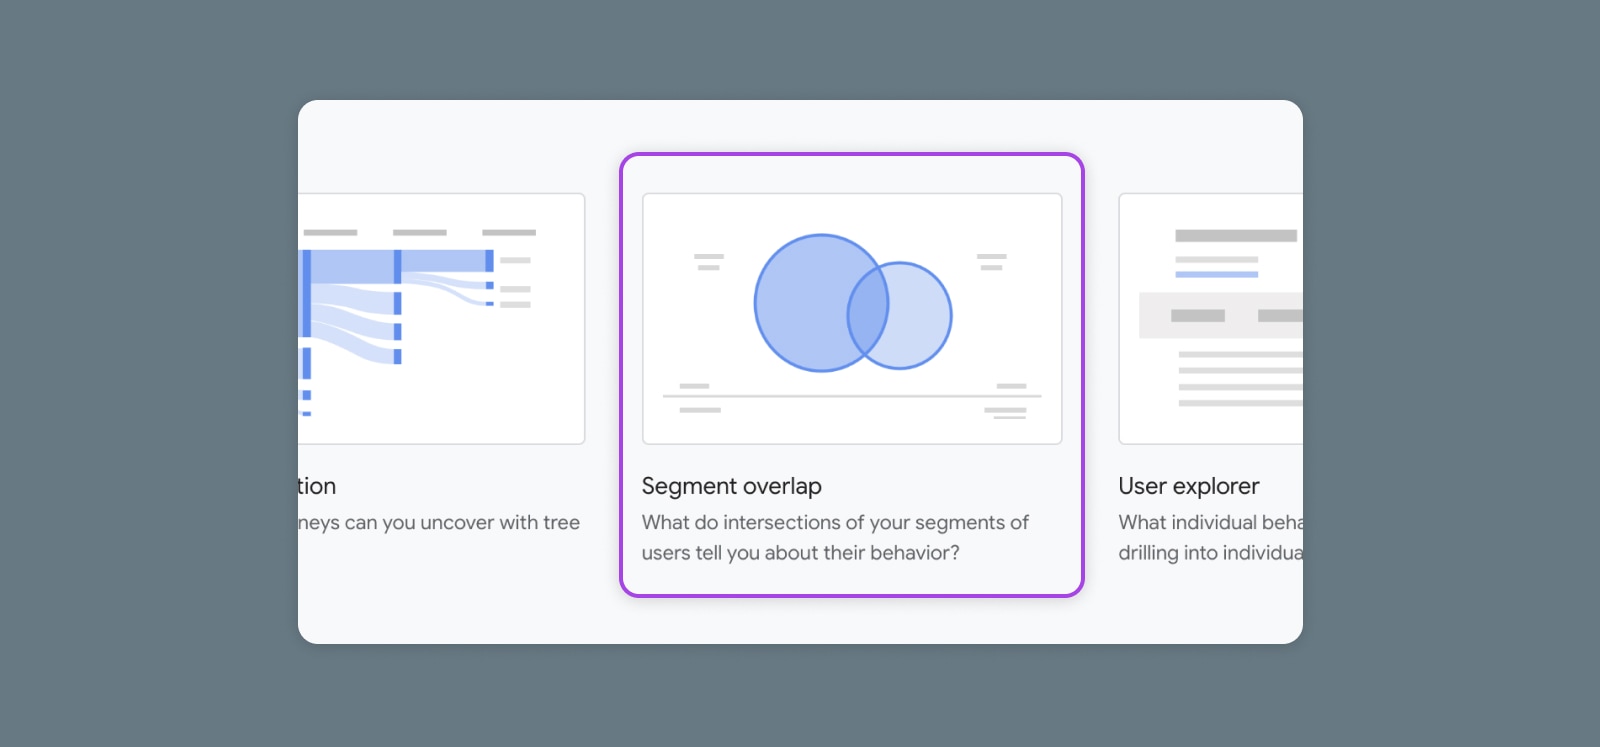
Segment Overlap

Segment overlap is self explanatory — this exploration displays what various segments (up to three as of now) have in common. Use this to discover new, highly-specific audiences.

User Explorer

With user explorer, you can look at groups of users as well as individuals — such as low spenders or high spenders — to understand what makes them tick and how you can replicate them.

Path Exploration

Use path exploration to create a detailed tree graph that visualizes how users move through your website or app.

User Lifetime

The user lifetime exploration can uncover individual user behavior and value during their time as your customer. Similar to user explorer, this exploration provides hints at what kinds of sources, campaigns, demographics, and behaviors may result in high lifetime value.

Once you’ve selected your template or technique, you’ll land inside the exploration editor, which Google calls the “canvas.”

Canvas

Within the canvas, you’ll notice a larger area on the right side of the screen that will display your data within your chosen technique. You can use multiple different techniques inside a single exploration. Just open a new tab toward the top of your canvas to create a new one (ten tabs is the limit as of now).

On the left side of the screen are two columns — Variables and Tab Settings — where all your configuration will be done.
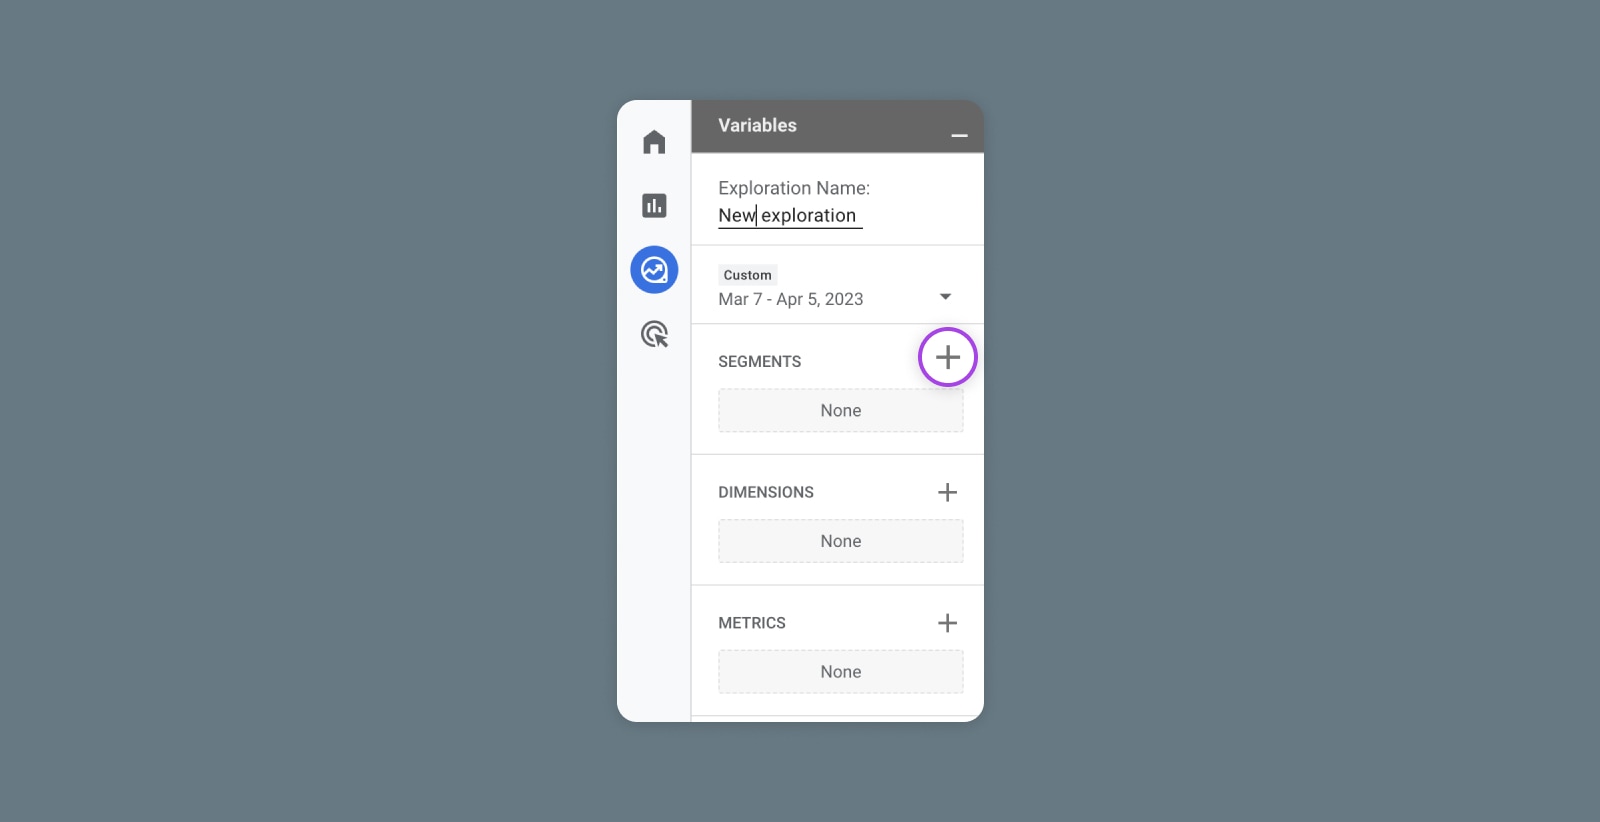
Variables

The left-most column is where your variables live. As of now, every exploration has these three main variable sections:

Segments are subsets of data such as users from a specific country, recently active users, users who haven’t made a purchase, users who have made a purchase, and so on. There are tons of ways to slice the data here. Google Analytics provides segment suggestions, but you can create your own or use their predictive functionality to build audiences based on the behavior it’s observed in your website or app.

Dimensions are attributes associated with data points like events, products, users, etc. For example, the dimensions of a product may be product name, product category, product price, product SKU, etc. Explorations has over 100 predefined dimensions, and customization is possible.

Metrics are variables for measuring. So metrics include things like number of active users, number of first-time purchases, number of checkouts, etc. Google provides over 100 options, and you can create your own as well.

For all of these variables, use the plus button to pop open a menu to view and save/import predetermined and custom variables. You can apply up to 20 dimensions and 20 metrics to each exploration.

GA4 Exploration Variables

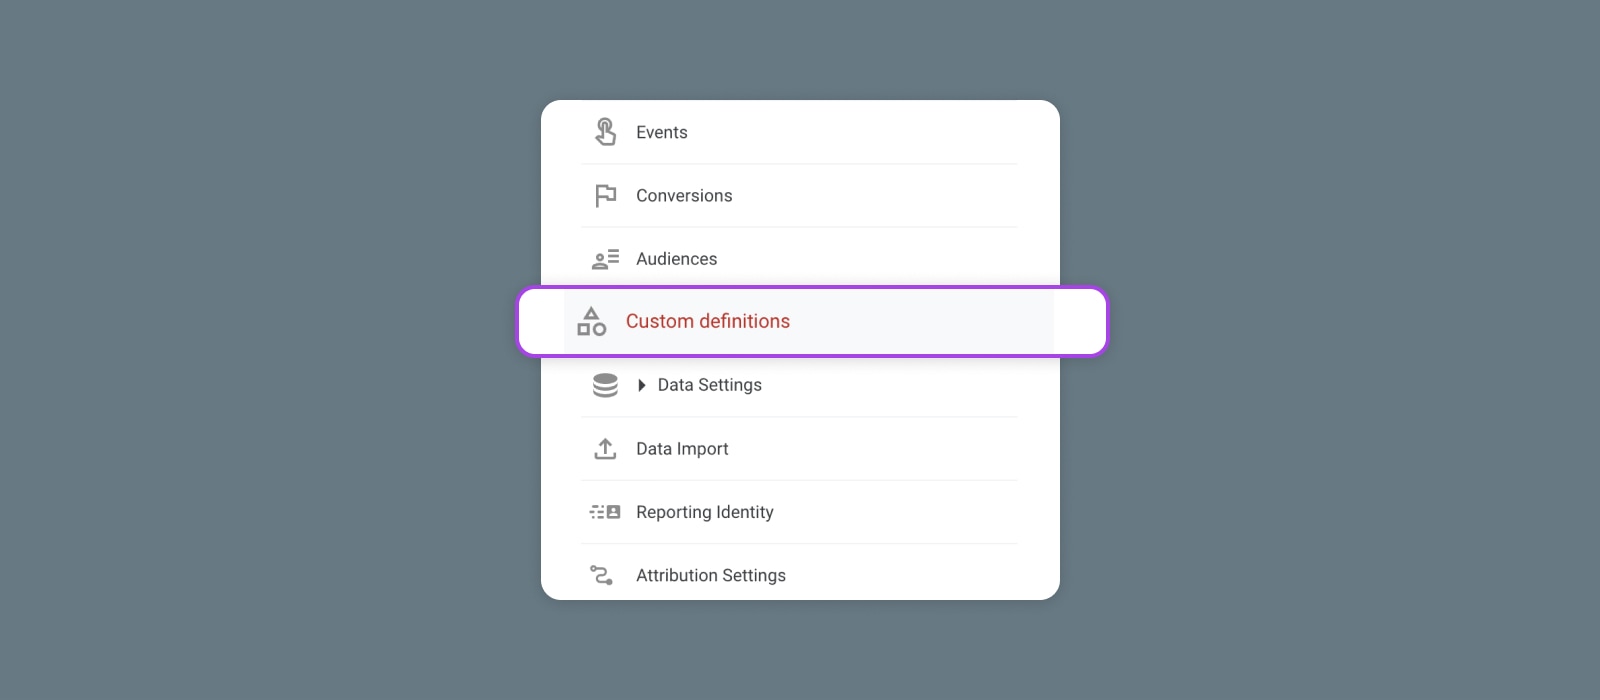
To create custom dimensions and metrics, visit the Admin gear icon at the bottom left of your screen, make sure you’re in your desired account and property, and select “Custom definitions.”

GA4 Explorations, Custom Definitions

One more thing you can do in this column is give your exploration a name and set a date range.

Any segments, metrics, or dimensions you want to see in your exploration, across tabs, have to be documented here in Variables. Variables is like the input section for all the analytics data your exploration will use.

Tab Settings

Now let’s shift our attention to the next column: Tab Settings.

While variables outline the segments, metrics, and dimensions of data you want to see in your exploration, Tab Settings is what displays that data according to the technique. Tab Settings gives data shape and context by applying rows, columns, filters, comparisons, and various other configurations. In other words, Tab Settings is where you tweak what your exploration actually looks like.

The Tab Settings that enable you to customize your exploration vary widely by technique.

For example, with a free-form report, you can configure your exploration chart’s rows and columns using your chosen dimensions. With the path technique, you will configure nodes instead (nodes are data points along the path). And with the funnel technique, your settings will include choosing the next action from your dimensions.

To apply variables to your Tab Settings, drag and drop them into the dotted box or click on the box for a dropdown menu of options.

GA4 Explorations, Segment

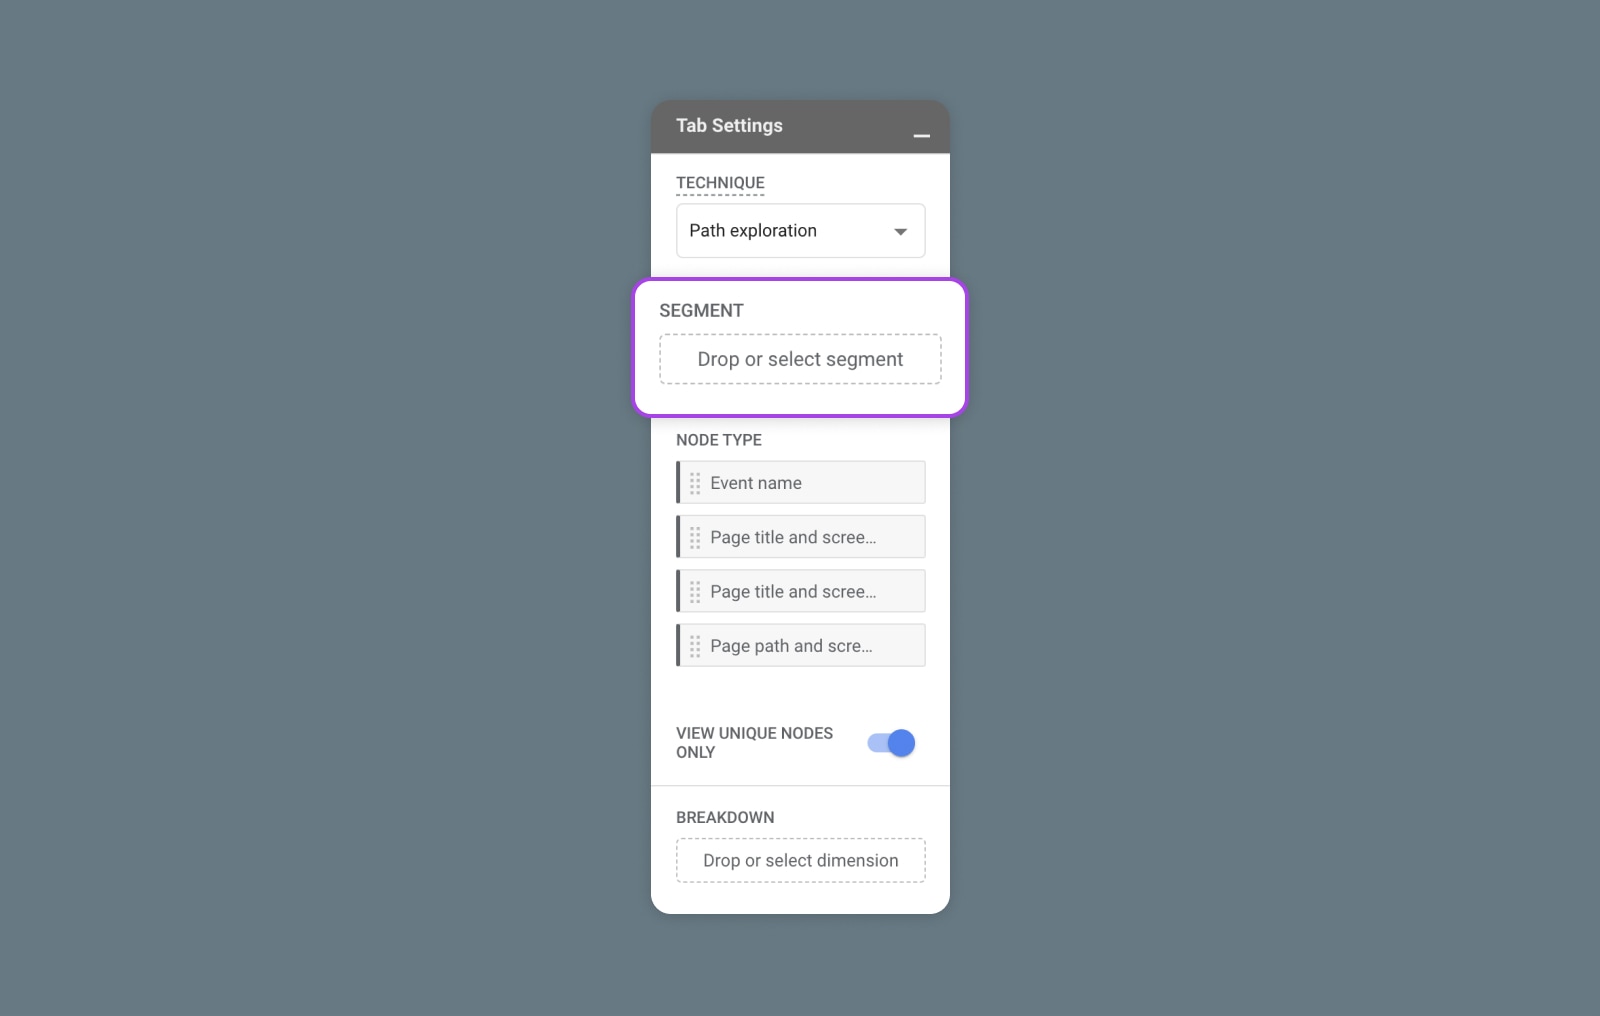
The dropdown menu at the top that enables you to choose your technique is constant across the Tab Settings for every technique.

To provide the details on how exactly to configure every single Tab Setting for every type of GA4 technique currently available, we’ll provide these quick links to Google’s guide to each:

Walkthrough: Create Your First GA4 Exploration (Segment Overlap)

The segment overlap technique is pretty unique as it enables you to pinpoint hyper-specific segments within your existing audience that you can then go on to explore further, draw insights from, and target with your marketing efforts.

So, let’s go through the full process of creating and sharing a GA4 exploration based on the segment overlap technique:

1. You know the drill at this point — sign in to Google Analytics, navigate to the GA4 property or app where you want to create this exploration, choose the Explore tab in the left sidebar, and hit the Explorations landing page.

2. Select the segment overlap template to open the canvas.

GA4 Explorations, Segment Overlap

3. In the Variables column, give this exploration a name and select the date range from which you want to pull data.

4. Still in Variables, use the plus buttons to add the segments, dimensions, and metrics that define the data by which you want to slice and dice your exploration.

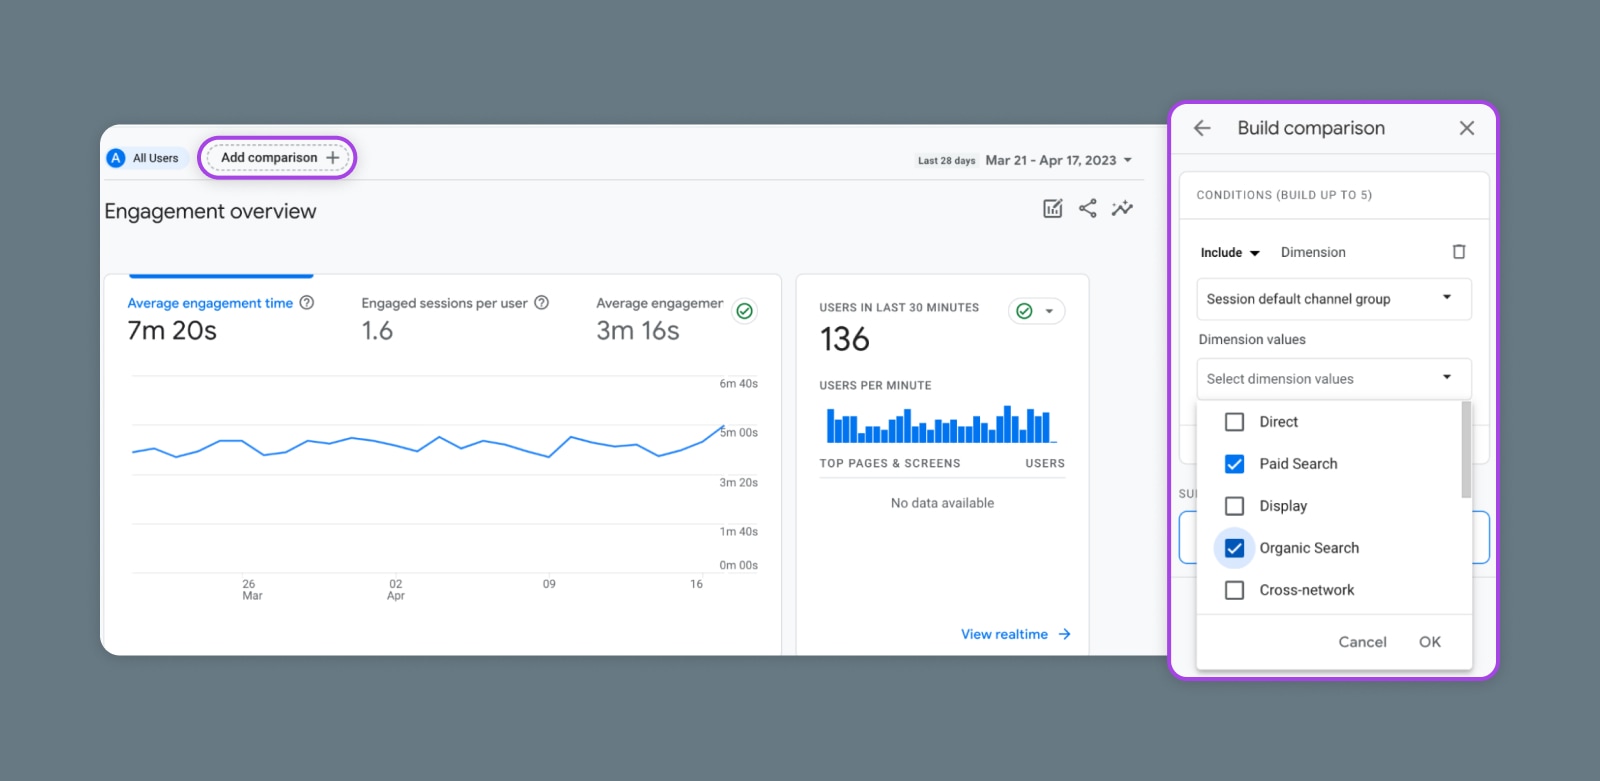
5. In the Tab Settings column under Segment Comparisons, you can pull in up to three segments to compare.

6. Fill out Breakdowns with dimensions, which are attributes that give further context to your segments, like country, device type, etc. These will make up your rows.

7. Pick the starting row for your table and the number of rows to display.

8. In the Values section, choose your metrics, which are qualitative measurements like number of ad clicks, number of sessions, etc. These will guide your columns.

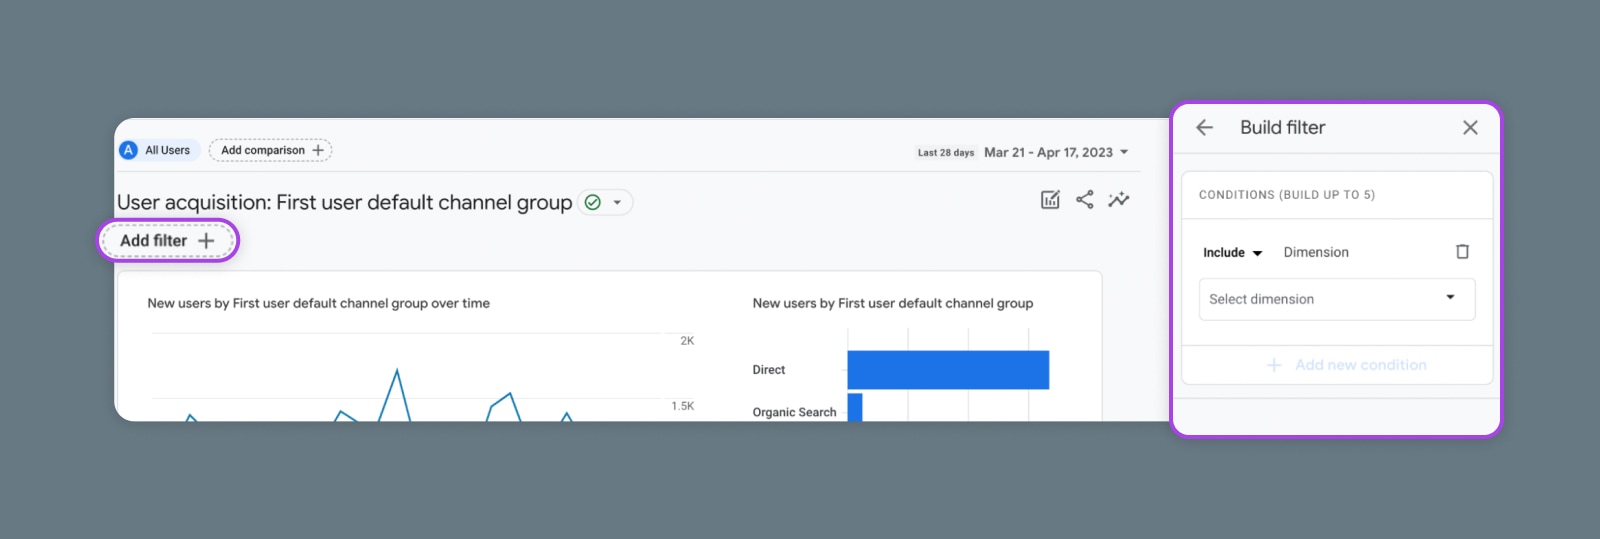
9. If you want to refine your results even further, add dimensions or metrics to the Filters section. This field enables you to get hyper-specific on what kind of device, which countries, etc. you can view your exploration by.

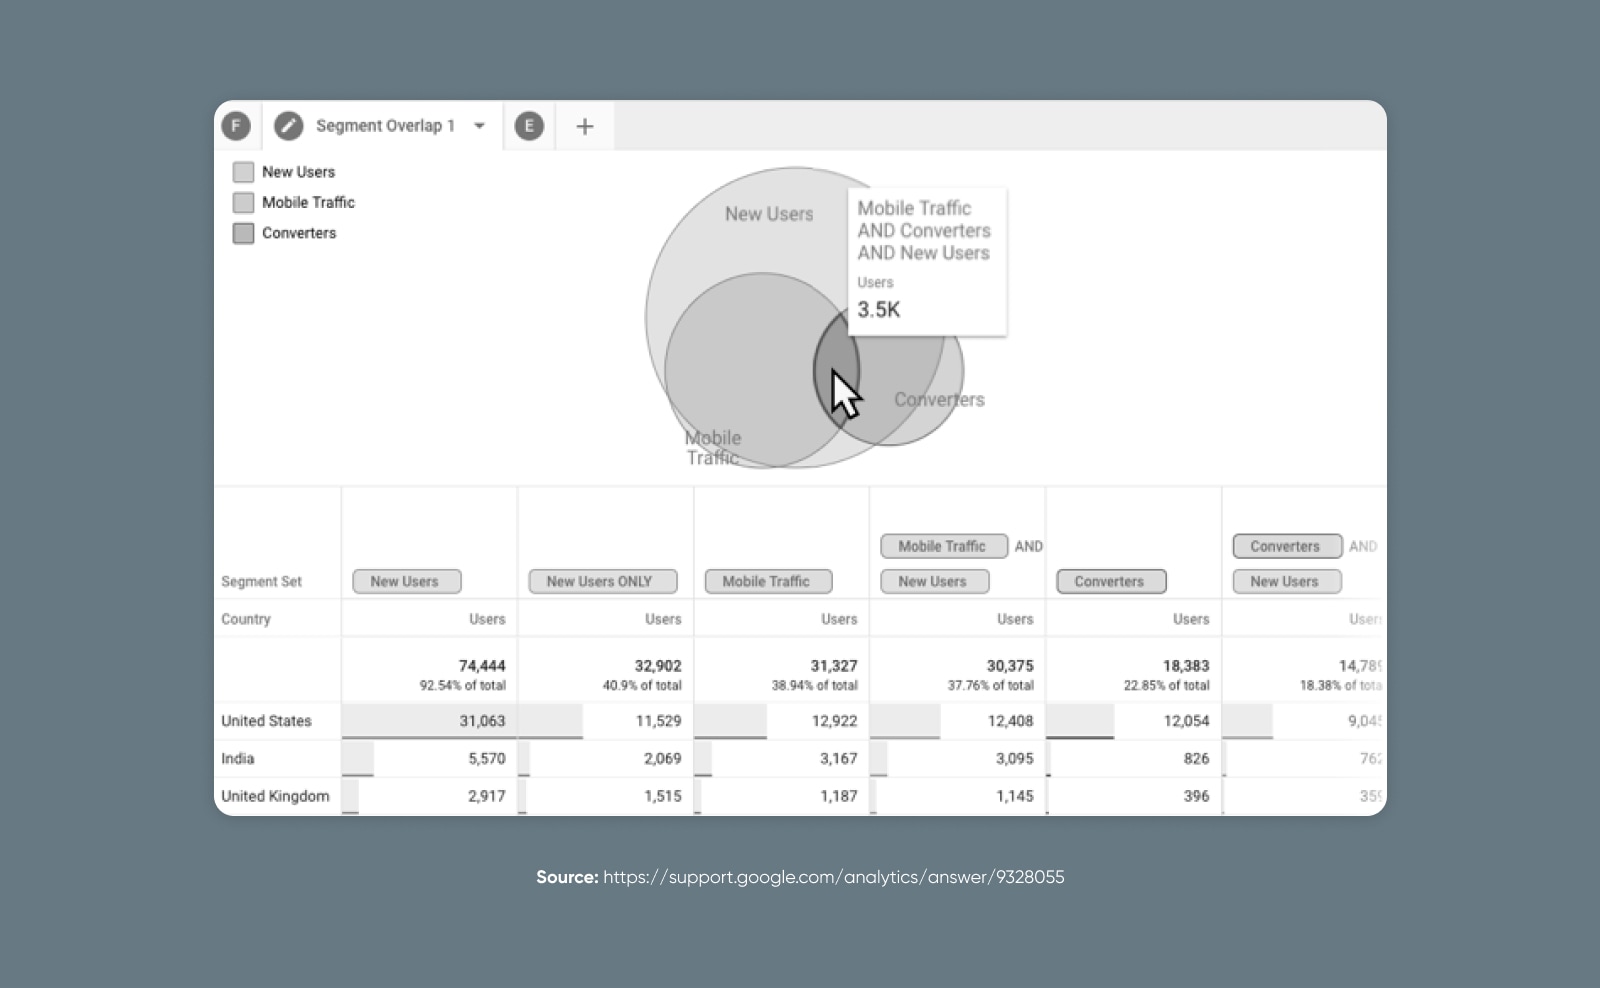
10. You should see a chart and table taking shape in your canvas. The graph you will end up with is interactive! Hover over different segments and overlapping sections to learn more about niches within your broader audience. The table below your new diagram shows the data upon which the graph is built.

This example from Google shows what it might look like if you created a segment overlap exploration to see where new users, mobile traffic, and converters user segments converge:

GA4 Explorations, Segment Overlap Example

11. If desired, you can now export and/or share your exploration. In the upper right corner of your canvas is what looks like a download button. This will give you options to export your data in a variety of ways.

GA4 Explorations, Export your data

You’ll also see a humanoid icon that enables sharing. This button shares the exploration with all other users who are already part of this Google Analytics property. Shared explorations are read-only. Folks who receive your share will have to go to their primary Explorations page (step 1 above), find the exploration you’ve shared (it’s just below the templates), and use the dotted menu to duplicate the exploration. This will create a new version, which they can use and edit in any way they please.

GA4 Explorations, Duplicate exploration

Explorations in GA4 are worlds more thorough than the Universal Analytics reports many of us have become very used to. And while that means great things for your depth of understanding around your audience and your digital properties, it’s obviously going to take a good chunk of time and work to get set up and get used to.

If you don’t have that kind of time and energy to spare at the moment, consider getting some help from DreamHost’s team of marketing pros.

Schedule a marketing consultation or start a chat on our marketing pro services page to see how we can help you grow and succeed in business.

Get More Visitors, Grow Your Business

Our marketing experts will help you earn more traffic and convert more website visitors so you can focus on running your business.

woman of color on laptop

The post Creating and Mastering GA4 Explorations appeared first on Website Guides, Tips & Knowledge.


source https://www.dreamhost.com/blog/ga4-explorations/

Friday 19 May 2023

18 Pro Tips for Choosing the Perfect WordPress Theme

There’s no shortage of website builders in 2023 for those looking for a robust and powerful CMS. But somehow, WordPress.org, an open-source content management system built in 2003, still takes the cake when it comes to customizability.

There’s a simple reason for this: Community.

WordPress has managed to tap into the international web design and development community at a scale that no other platform comes close to.

Over the last two decades, this community has contributed tens of thousands of themes, plugins, and other assets to the platform, giving it new ways to customize the look, feel, and functionality of your website or blog.

Customization is an essential part of the WordPress experience, with themes playing a huge role. So let’s take a look at some top tips and tricks to help you choose the perfect theme for WordPress.

How to Install a WordPress Theme

Once you have your website up and running on WordPress — complete with its own domain and hosting — installing a theme is actually very simple.

Just access your WordPress dashboard and navigate to the Theme > Appearance tab. Once there, select the Add New button at the top of the page.

WordPress will then allow you to upload the .zip file that you received after purchasing your theme or download whichever WP theme from the that you chose. When the theme is in place, all you have to do is go to the Themes tab and hit the Activate button, and your new theme is ready to go.

Get Content Delivered Straight to Your Inbox

Subscribe to our blog and receive great content just like this delivered straight to your inbox.

#1 What Is Your Website’s Purpose?

“Never forget what you are. The rest of the world will not. Wear it like armor, and it can never be used to hurt you.”

Tyrion Lannister was clearly on to something here. While he wasn’t talking about WordPress websites specifically, it’s clear that aligning yourself on the purpose and reason behind your website can be just as important.

Just ask yourself these two very important questions before you do anything else:

  • What’s the point of my website? (Example: Personal blog, ecommerce store, bragging rights, small business, or educational nonprofit.)
  • Who is my intended audience? (Example: Accounting professionals, vintage toy collectors, or kombucha enthusiasts.)

#2 Prioritize Performance and Speed

If there’s one thing people hate, it’s a slow website. There are a lot of factors that can affect your site’s speed, but the theme you pick will play a significant role. Some themes are better optimized than others, so they tend to be faster across the board.

It can be hard to gauge a theme’s level of optimization without taking it for a test drive, but you can look at existing reviews and run a speed test (via WebPageTest or GTmetrix) on the theme’s demo website to get a quick idea.

#3 Look through Competitor Websites

In many industries, you’ll find that websites tend to share very similar styles. If your audience expects a specific aesthetic, you’ll need to consider whether you want to provide what they’re looking for or try to give them something unexpected.

If you’re all out of inspiration, check out Awwwards and Lapa.Ninja for some award-winning websites specific to your industry and space.

But it’s not enough just to look at these websites. Examine their design aesthetic and look for patterns in their visual style. For example, here are some things to be on the lookout for:

  • Color schemes
  • Typography choice
  • Graphic design
  • Visual hierarchy
  • Important functionality

#4 Check for SEO Friendliness

Search Engine Optimization (SEO) is key to your website performing well in search results. The quality and consistency of your content and the optimization of your metadata affect your page ranking.

DreamHost Glossary

Metadata

Metadata refers to ‘data about other data’. It is information within files that explains what type of file you’re dealing with. Common examples of metadata include file size, modification dates, who created the file, and more.

Read More

Why does rank matter? Well, the higher your website falls on the search engine results page, the more people will visit your website.

And you guessed it: your theme matters when it comes to SEO. WordPress sites that perform quickly, are responsive (see above), and are built with clean code are great for SEO.

#5 Ascertain Ease of Use

A user-friendly backend allows you to manage and update your website content more efficiently. This saves time and lets you focus on other aspects of your business or project.

While you may want to buy that fancy-looking multipurpose WordPress theme with a live customizer built in, it’s much better to look for something simple and functional if you are new to WordPress. Keep it simple, smarty! Make sure that your theme is complimentary to your level of expertise and comfort with WordPress.

#6 Confirm Relevant Plugin Support

Plugin compatibility issues can manifest in many ways. If you are picky about the theme and plugins you use, these problems should be few and far between. That being said, if you have specific plugins in mind for powering key functionality on your website, it’s worth checking to ensure your top theme options are compatible.

For example, WooCommerce is the number one plugin for implementing ecommerce functionality. As such, WooCommerce theme integration is a key consideration if you want to start an online store.

A few other popular WordPress plugins and features that you might want to consider include:

  • Elementor
  • MemberPress
  • BuddyPress
  • LifterLMS
5 Ways to Customize WordPress Themes

#7 Look for Customization Options

Usually, the first thing you’ll notice about a theme is what it looks like — if it fits your idea of what you want for your website. In most cases, you’ll need to make some changes to any theme you choose in order to get it looking just right.

Let’s say you’ve done your research and found a theme that’s 90 percent perfect. For instance, you like the layout of the pages, how the menus function, and the overall theme design, but the fonts aren’t quite what you had in mind.

Fear not, it still might be a good choice for your website. One of the great things about WordPress sites is that they are incredibly customizable, especially when you use plugins. Check out our guide to customizing a WordPress theme to get started!

#8 Analyze Reviews and Ratings

A theme’s reviews and ratings are a valuable indicator of what to expect. When it comes to popular themes, you’d be surprised at how many user ratings you can find.

All themes in WordPress.org’s Theme Directory are ranked from one to five stars and feature customer reviews. Look for themes that speak to your site’s purpose and aesthetic ideal, then read the reviews to see what people are saying.

#9 Confirm Regular Developer Support

If you run into any issues with your theme, it’s always nice to know that you can turn to its developers for advice on how to solve it. Ideally, your theme’s developers should provide you with multiple support channels, actively trying to help their user base.

But support isn’t limited to customer service. WordPress is a platform that undergoes regular updates, some of which massively change the functionality of the core platform. Themes need to be updated on a regular basis to keep up with these changes (things like the new page builder and block editor!)

#10 Check for Multilingual Functionality

There are a lot of tools you can use to translate your WordPress pages and create a multilingual website. However, for this to work, you’ll want to use a theme that’s translation ready. Try and look for compatibility with the following plugins to get started:

  • TranslatePress
  • Polylang
  • WPML
  • Weglot
  • MultilingualPress

Given that English is used by only 26% of global internet users, multilingual support is a feature that’s worth investing in.

#11 Prioritize Accessible Design Practices

WordPress websites that prioritize accessibility are a win-win for everyone involved. Look for themes built to create a user-friendly experience for people with disabilities, keeping in mind things like color contrast, typography choice, and visual hierarchy.

DreamHost Glossary

Typography

Typography is a process of arranging a typeface in variations of font, size, and spacing. This involves making text’s appearance, style, and arrangement readable and visually pleasing.

Read More

A lot of these things can be adjusted when customizing your theme, but it still helps to have a good starting point. Also remember to test your chosen theme for compatibility with screen readers and keyboard navigation, since integrating these features into a theme that doesn’t already support it can require a lot of effort.

#12 Search for Ecommerce Support

WooCommerce is the most feature-complete WP plugin for ecommerce websites. Looking for themes that specifically support WooCommerce is a good way to ensure ecommerce compatibility for your website.

You should be looking for dedicated inner pages and templates to seamlessly showcase your products. Even if your theme doesn’t mention WooCommerce specifically, check to ensure that the theme’s demo website contains ample examples of ecommerce content like a shopping cart and checkout page.

Search for Ecommerce Support

#13 Check Pre-Built Template Variety

Pre-built templates and block patterns provide ready-to-use designs for various page layouts, such as the home page, landing pages, blog pages, or contact pages. This can save you significant time and effort when setting up your website, as you won’t need to create these layout options from scratch.

When evaluating a new theme for your website, look for the number of pre-built templates and block patterns available within the demo content. Then, prioritize themes with a good collection of templates that match both the layout and the aesthetic you’re looking for.

#14 Stick to Reputable Sources

Themes from reputable sources are less likely to contain malicious code, security vulnerabilities, or hidden backdoors that could compromise your website’s safety. Reputable theme developers also invest more time and effort into creating high-quality themes that adhere to design and coding best practices.

Here are a few examples of reputed websites for purchasing and downloading themes for your WordPress:

    • WordPress Theme Directory: The WordPress.org repository offers a wide selection of free WordPress themes that adhere to strict quality and security guidelines.
    • StudioPress: Known for their drag-and-drop Genesis Framework, StudioPress offers a range of SEO-friendly themes with professional designs and great customizability.
    • Elegant Themes: The creators of the popular Divi theme, Elegant Themes provides a collection of well-designed and feature-rich themes backed by excellent customer support professionals and a solid refund policy.

#15 Evaluate Affordability and Pricing

When it comes to WordPress themes, one of the most critical decisions you need to make is whether to go with a free or a premium option.

Premium themes tend to pack in a lot more functionality to justify their price tags. But, WordPress.org really does offer a plethora of great themes in its directory. WordPress volunteers do an excellent job of vetting these themes, which are submitted by third-party developers, to make sure that the code is up to, well, code.

To get started, do a search to find free themes that match your site’s criteria and then check out their demos to get a sense of how the theme would look with your content.

But if you are going to invest in a paid theme, marketplaces like StudioPress and Elegant Themes offer excellent options. Just be sure to read through the developer’s refund policy and know what level of support you can expect before you go and make your purchase decision. On that note…

#16 Double-Check the Refund Policy

If you’re going to invest in a premium theme, it’s important to check the refund policy of purchase to ensure that you have sufficient time to decide on its quality. Lots of themes offer a 30-day no questions asked refund policy — so that you have plenty of time to test things and contact support should you encounter issues.

The same goes for theme builders, too. Many of them offer a free trial or have a return policy in place for handling dissatisfied customers. Just be on the lookout for this when reading through their features and terms.

#17 Take a Mobile-First Approach

Responsive design is a must-have feature for most bloggers and website owners, but the mobile-first approach takes it one step further. By designing your WordPress theme for mobile devices first, you can ensure that the devices with the trickiest design requirements, with a huge variety of screen choices and hardware options, get the most attention from your design team.

While not all industries necessitate a mobile-first approach, it’s still a great feature to be on the lookout for to ensure that mobile users have the best user experience possible when accessing your site.

#18 Ensure Modern Browser Compatibility

Although most people use the same popular browsers — such as Chrome, Firefox, and Safari — they’re far from the only options. There are dozens of browsers you can choose from, and not all of them render content and images in the same way.

Good developers know this, and ensure that their themes play nicely with most browsers by following established best practices for coding and design.

Global Internet Browser Market Share from Jan 2012-2023

Why Is it So Important to Choose the Best WordPress Theme?

If you have any friends who use WordPress (the numbers say you probably do), ask them how long they’ve been using their current theme. In most cases, the answer will number in years.

Changing your WordPress theme can be tricky, as it will radically alter the appearance and even the functionality of your site. That’s why it’s better to make a great choice the first time around and stick with it as long as possible.

Themes are one of the key features that make WordPress an amazing platform. You have literally thousands of themes that you can choose from. Neve, OceanWP, and Astra are some great examples to look into, if you don’t know where to start.

This is not a decision to be taken lightly. Your choice of WordPress theme will impact your website’s SEO, visitor experience, conversion rates, and much more.

Are you ready to start using your new theme? You’ll first need to pick a WordPress hosting service that plays well with the platform’s unique requirements. Fortunately, we have plenty of plans for WordPress users to choose from!

Do More with DreamPress

DreamPress Plus and Pro users get access to Jetpack Professional (and 200+ premium themes) at no added cost!

The post 18 Pro Tips for Choosing the Perfect WordPress Theme appeared first on Website Guides, Tips & Knowledge.


source https://www.dreamhost.com/blog/how-to-pick-wordpress-theme/

Tuesday 16 May 2023

GA4 Reports: A Comprehensive Guide to Acquisition, Conversions, and More

Before GA4, there was….

….UA….

And, before UA, there was….

…GA….

And, before GA, there was….

….Urchin?

Okay… Seriously, I have no idea who’s in charge of naming stuff at Google. But here we are.

Google Analytics 4 (GA4) as an analytics tool for website and app performance.

GA4 is set to replace Universal Analytics, which is the current generation of Google Analytics software used by 86% of websites on the Internet with traffic analysis tools installed.

In the digital marketing world, it’s like the new model of your favorite car. The response is split. Some marketers love it. Some hate it.

But we’re all going to have to take it for a spin because UA is set to sunset in July of 2023 and GA4 will replace it permanently.

In this guide, we’re going to dive deep into GA4 reports — covering the metrics, conversions, visualizations, and more.

Understanding how to master the Reports tab in GA4 is essential for anyone whose work involves marketing campaigns, SEO, website engagement and retention, e-commerce, or just about anything else you’d want to track.

Understanding the GA4 Reports Tab

First, let’s get oriented.

Understanding the GA4 Reports Tab

GA4 Reports tab is the central hub for accessing and analyzing data in a GA4 property.

These are the reports available in GA4:

  • Reporting Snapshot
  • Realtime
  • Acquisition
    • Overview
    • User Acquisition
    • Traffic Acquisition
  • Engagement
    • Overview
    • Events
    • Conversions
    • Pages and Screens
    • Landing Page
  • Monetization
    • Ecommerce Purchases
    • In-App Purchases
    • Publisher Ads
    • Promotions
  • Retention
  • Demographics
    • Overview
    • Demographic Details
  • Tech
    • Overview
    • Tech Details

In this guide, we’ll walk through each section and explore how you may use the data to inform marketing campaigns, ad spend, and more.

But before we get into the weeds, it’s important to note that you can break down all of the reports into two main types:

  1. Overview Reports: high-level summary of key metrics (e.g., user acquisition, engagement rate, event count)
  2. Detail Reports: specific dimensions and metrics for detailed analysis (e.g., demographics, device category, event name)

GA4 also offers some new report features such as path exploration and exploration reports, but we’ll cover those in a separate guide.

For this article, we’ll work our way straight down the list of reports along the left menu.

Get Content Delivered Straight to Your Inbox

Subscribe to our blog and receive great content just like this delivered straight to your inbox.

Reporting Snapshot

If you’re looking for the quickest sense of how your website is performing, then you can pop right into the Reporting Snapshot.

Reporting Snapshot

You can think of this page as a pre-built analytics dashboard.

It blends data from all of the other reports into a single view that gives you a general sense of how much traffic you’re receiving, where your traffic is coming from, and what actions users are taking on your website.

Real-Time Reporting in GA4

Realtime reports in GA4 work almost the same way as they did in Universal Analytics. You can get a real-time snapshot of the users on your website over the last 30 minutes.

You’ll see key data such as:

  • Active users
  • Top active pages
  • Top events
  • Geographic data

The realtime report is a cool way to see what’s happening right this second. But if you want to dive into a more comprehensive analysis, understand behavior across a user’s life cycle, or compare metrics across different date ranges, then you’ll need to dig into the relevant reports below.

Acquisition Reports

Acquisition is about understanding how users got to your website.

Inside the acquisition section, you’ll see 3 different reports.

1. Acquisition Overview

The Overview report is similar to the Snapshot above but looks only at metrics related to acquisition. You can see a combination of data about the way users find your website plus which channels or campaigns are driving the most traffic.

2. User Acquisition

The User Acquisition report filters your traffic to only look at how New Users arrived at your website for the first time. This is helpful if you want to better understand how people are learning about your website and help you with digital marketing attribution.

Basically: How did people find us in the first place?

For instance, you may be wondering: Do more people find our website through Instagram and then click on an ad? Or do they click on the ad first and then find us through Instagram?

User Acquisition report

The default view for the User Acquisition report would help you answer that question by showing you the First User interaction by default channel group.

You can also toggle this report by clicking the dropdown and grouping acquisition by other dimensions like Source, Medium, or Campaign.

3. Traffic Acquisition

This report shows much the same data as User Acquisition, but it isn’t filtered to show only New Users. Instead, it allows you to see the source or channel that drove traffic to your website – regardless of whether it’s that user’s first visit or their hundredth.

The default channel grouping will break down your traffic into buckets like referral traffic from other websites, organic traffic from search engines, paid search ads, email marketing, and other common buckets.

DreamHost Glossary

Organic Search

Organic search describes the unpaid results in the Search Engine Results Pages (SERPs). These are ranked only by a search engine’s algorithm.

Read More

Engagement Reports

So now we know where the traffic is coming from. But what do they do once they get to our website?

That’s what Engagement Reports are all about.

This data will help you answer key questions like:

  • Which content was most popular on your website?
  • Which links did people click on?
  • How many users completed goals or purchases?
  • Which pages brought people to the website in the first place?

Basically, we’re about to turn this analytics get-together into an analytics party.

1. Overview

As expected, the Overview is once again like a snapshot of the data shown below.

Here you can get a high-level summary of the details you’ll find in the subsequent reports.

2. Events Report

Events report is where the magic happens.

Here you’ll be able to see granular data about the actions your website visitors are taking.

By default, you’ll see things like page_view, scroll, click, first_visit, and more.

Events Report

(“Page Views” are considered an event on GA4.)

You can create up to 50 custom GA4 events to track things like sign-ups, subscriptions, or other actions.

If you click on each event, you can drill down further to see more information about the actions, when and where they occurred, and other details.

3. Conversions Report

In addition to all of the events on your website, it’s likely that some of these actions represent an actual conversion that’s correlated with sales or revenue.

For instance, when a user creates an account or makes a purchase.

When you configure GA4 events, you can indicate whether each specific event should be treated as a conversion. If you mark the event as a conversion, then those events will appear in this special report.

This gives you a filtered view of the conversions that have been completed. And you can drill down to see where those conversions came from and other relevant information.

(Nerd note: In GA4, events marked as Conversions have completely replaced “Goals”.)

4. Pages and Screens

This report is similar to the “Page Views” report that you may be used to seeing in Universal Analytics.

You can quickly see which pages on your website have racked up the most views, have been visited by the most users, and have contributed the highest number of conversions.

The default report will show pages by their title, but if you are used to browsing pages by their URL, then you can change the view from the dropdown above the list of pages.

5. Landing Pages

Landing pages are the first pages that a user sees when they come to your website on any given session. It’s like if you had a massive house with dozens or hundreds (or thousands) of front doors. You may want to know which ones your guests are using.

(Because obviously, if you have a house that big, you have guests coming and going constantly.)

The Landing Page report basically tells you which door(s) your visitors use most frequently.

Landing Page report

This gives you a good sense of which pages or content are most attractive to users, getting the most visibility in organic search results, or generating the most buzz on social media.

Monetization Reports

As you probably guessed by the name, Monetization Reports are built to help you understand how and where your website is generating actual revenue.

1. Overview

Get a snapshot of the revenue your website generated, the number of purchases made, the average value across your visitors, and more from the Monetization Overview report.

Monetization Overview report

2. Ecommerce Purchases

If you have an e-commerce website or an online store, you should configure ecommerce tracking within GA4.

This will allow you to see all the purchases made on your website, browse your specific products to see which are most popular / generating the most revenue, and other data that will help you optimize sales and grow your business.

3. In-app Purchases

If your website or mobile app offers users the chance to make a purchase (e.g., buying extra spins on that virtual slot machine or signing up for a paid subscription to your SaaS), you can configure that action as an in-app purchase.

Then you’ll be able to use this report to see all the in-app purchases and information about who made those purchases and where they occurred.

To set this up, you’ll simply need to fire an event named “in_app_purchase” when a purchase is completed.

4. Publisher Ads

Suppose your website or mobile app is monetized with advertisements. In that case, this report will help you see how much you’re earning, which ads are generating the most revenue, and which pages are generating the most impressions and clicks on the ads.

This report integrates directly with Google Ad Manager or AdMob to generate data. If you’re using another ad network, then you’ll need to pass ad data manually.

5. Promotions

The final monetization report is the Promotions Report.

This simplifies the way that you track promotions like special offers, discounts, and coupons. Whereas you may have created custom tracking parameters and other systems in Universal Analytics, you can now directly configure specific promotions and then track their impact on revenue.

For instance, you can run a banner offering 10% off a product and then measure to see how many purchases and how much revenue that specific promotion generated.

Retention Report

Parting is such sweet sorrow.

But if your retention metrics are right, then you won’t even sweat it —  You know those users will be right back.

The Retention Report gives you a simple snapshot of how many new users are visiting your website versus the number of returning users.

Retention Report

You can take it one step further by looking at retention over time, retention by cohort, and other advanced reports that help you better understand if and when users are most likely to come back to your site in the future.

Demographics Report

Do you ever wish you could just walk up and shake the hand of your website visitors and get to know them?

Well, that would be a bit creepy.

But you can at least learn a bit more about them from a distance with the Demographics Report.

1. Overview

Demographics Overview report

The Demographics Overview report shows you all kinds of information about the people who visit your website:

  • City and Country
  • Language
  • Age
  • Interests
  • Gender

You can see if your website tends to attract visitors from certain parts of the world or if it’s more popular with men or women. This can be helpful when you’re thinking about future marketing and promotional activities.

2. Demographic Details

This report overlays the demographic data from the Overview with Engagement Report data.

Now you can see not only which groups are visiting your website most frequently, but also which groups are most engaged, make the most purchases, spend the most time on your website, and more.

Tech Report

The Tech Report shows you which devices, systems, and browsers people use when visiting your website.

Overview

The Overview shows a breakdown similar to the Demographics Report, highlighting the types of systems and devices that are used more frequently by users coming to your site.

Tech Details

The Tech Details, also similar to the Demographic Details, correlates the different technology and devices used by your website visitors with Engagement data.

You may be able to use this data to identify issues like poor site performance on certain screens or browsers.

Now that we’ve gone around the world, let’s quickly zoom in on some ways that you can use the Reports Tab to better understand your audience and make data-driven decisions about your website and your business.

Applying Filters

Filters allow you to look at specific segments of your traffic and better understand how certain groups of users interact with your site.

To apply a filter, simply open any of the detailed reports we’ve covered in this guide.

Find the “Add filter” button under the report name and click on it.

Navigating and Customizing GA4 Reports, Add Filters

From here, you can create a custom filter based on up to 5 dimensions.

Comparisons

With comparisons, you can see how two groups interact side-by-side. For instance, you can look at how organic search traffic compares to paid search traffic.

To create a comparison from any GA4 report, simply click the “Add comparison” button above the report title.

Navigating and Customizing GA4 Reports, Add Comparison

Then, configure a comparison based on the dimension you want to segment.

Date Ranges

Every GA4 report (except realtime reports) shows data from a specific range of time.

By default, the reports will show the Last 28 Days. But you can change the date range at any time by simply clicking on the date range shown in the top-right corner of the report and setting a new range.

Navigating and Customizing GA4 Reports, Date ranges

Search Bar

Not finding what you’re looking for in GA4?

Try using the search bar!

At the top of the GA4 window, you’ll find a search bar where you can look for specific reports or data. You can also ask plain-language questions using the Analytics Intelligence feature.

Custom Reports

The default reports offer a lot of data, but depending on the website and the business, you may need a different concoction.

The “Custom Reports” feature is like a build-your-own sundae bar for analytics.

Choose your favorite dimensions, metrics, and filters, then mix and match to create a one-of-a-kind report. Whether you prefer a simple overview or a decadent data feast, custom reports satisfy every analytics craving.

Create Custom Reports on GA4

To create a unique report, just click “Library” at the bottom of the Reports tab menu.

You can even customize the standard report templates to get them to show data in just the way you like.

(Note: You’ll need Editor or Admin access to view the Library.)

Going Beyond the Reports Tab

Alright, so we’ve covered a ton of reports you’ll find in GA4. But, really, we’ve only scratched the surface of what kind of data you can compile and analyze.

Here’s a few additional things you may want to explore:

Explorations and Visualizations

One of GA4’s most popular new features is the Explorations tab.

Since we’re focused on the Report tab in this article, we won’t cover all of the details for how to use it. But, suffice to say that Explorations unlocks a whole new set of capabilities.

With GA4 Explorations, you can conduct free-form data analysis and build custom visualizations.

For instance, you can create a Funnel Exploration to help you better understand how users arrive on your website and then flow through it. You can also explore specific user paths with the Path Exploration and compare audience segments (including secondary dimensions!) visually with a Segment Overlap analysis.

Integrations

If you’re really ready to roll up your sleeves, your ability to build custom GA4 reports is only limited by your imagination (and your technical skills).

GA4 comes with a huge range of native integrations and can share data with most of the common Google products and other data analysis tools.

  • GA4 integrates with Google Tag Manager for custom event tracking and conversions.
  • GA4 integrates with BigQuery for advanced data analysis using SQL-like commands.
  • GA4 can be linked with Google Search Console for SEO analysis and optimization.

That’s All GA4 Now, Folks

Hopefully you’ve found this review of GA4 reports helpful.

Although there’s some big changes from UA, getting used to the new version of Analytics will just take time. After a few months, you’ll be a pro who doesn’t think twice about pulling the perfect report from the data stream.

Until GA5 comes out….or whatever the heck they decide to call the next one.

Get More Visitors, Grow Your Business

Our marketing experts will help you earn more traffic and convert more website visitors so you can focus on running your business.

The post GA4 Reports: A Comprehensive Guide to Acquisition, Conversions, and More appeared first on Website Guides, Tips & Knowledge.


source https://www.dreamhost.com/blog/ga4-reports/

Creating and Mastering GA4 Explorations

In the switch from Universal Analytics (UA) to Google Analytics 4 (GA4) — which will go fully into effect July 2023 — a lot of things have...