Whether you’re selling products or promoting your brand new keto diet blog, you’ll surely want to find ways to boost your site’s performance and organic search rankings. The good news is, if you invest consistent time and energy into improving your website’s Search Engine Optimization (SEO), you’ll eventually be rewarded. However, SEO’s ever-evolving nature can make it difficult to know where to get started, and where to see the most impact.
Thankfully, Google Search Console provides us with a full suite of tools and reports designed to help you make meaningful SEO improvements. By monitoring these performance reports, you will discover new information about your website’s organic presence, page experience, mobile usability, and much more. You’ll then be able to use this data to optimize your site and start ranking higher in search results.
Woohoo!
In this post, we’ll explain what Google Search Console is and how to verify your website. Then, we’ll show you how you can use this handy tool to improve your website’s visibility on Google. Let’s get started!
What Is Google Search Console?
Google Search Console (GSC) is a free dashboard that enables any website owner to improve their site’s performance in Google Search results. Previously known as Google Webmaster Tools, it gives you everything you need to boost your search rankings:
Even if you’ve never used Google Search Console, your site will be included in Google Search results. After you verify your website in Search Console, however, this tool can help you understand how Google views your website. This way, you can begin to optimize it for search engines.
For example, you can use detailed performance reports to view how often your site shows up in search results. GSC will also confirm that Google is able to crawl your content, alerting you to indexing, spam, or other problems.
Essentially, if you own a website, you can benefit from Google Search Console. Whether you are a business owner or a content marketer, you can use this set of tools to monitor your organic traffic and start optimizing for SEO. This can help you build and grow a successful website.
Get Content Delivered Straight to Your Inbox
Subscribe to our blog and receive great content just like this delivered straight to your inbox.
Key Differences Between Old Search Console and New Search Console
Like most of Google’s services, Search Console is constantly updated with new features and functionality. One of the most important updates happened in 2018 when Google launched a completely new version of Google Search Console.
With this new version came more detailed performance analytics. Here’s what you can now expect from GSC:
- Index Coverage report: Notice which of your web pages Google has indexed and whether it has encountered any indexing problems.
- Improved Performance report: Review Search analytics data from the previous 16 months.
- Links report: Gain information about who links to your website.
- URL Inspection: View crawling, indexing, and serving information for any searched URL.
Since 2018, there have been even more features added to Google Search Console. Currently, GSC has a full range of tools including:
- Core Web Vitals report: Measures user experience via loading, interactivity, and visual stability.
- Page experience report: Allows you to view which percentage of your URLs provide a good experience for visitors.
If you’re used to the older version of Google Search Console, you can use some of its same features and reports. That’s because the update retained the reports on sitemaps, Accelerated Mobile Pages (AMP), mobile usability, and security issues.
While this update brought new features, it also removed some. Compared to the old Search Console, there are no longer HTML Improvements, Property Sets, or Android Apps.
How to Get Started with Google Search Console (In 2 Steps)
Now that you understand the benefits provided in the new Google Search Console, you’ll likely want to sign up for this free tool. This way, you can start making improvements to boost your search rankings and draw in new visitors.
Step 1: Add a New Website
To get started with Google Search Console, sign into your Google account. Then, go to the Google Search Console home page and click on Start Now. This will allow you to add your website to GSC:
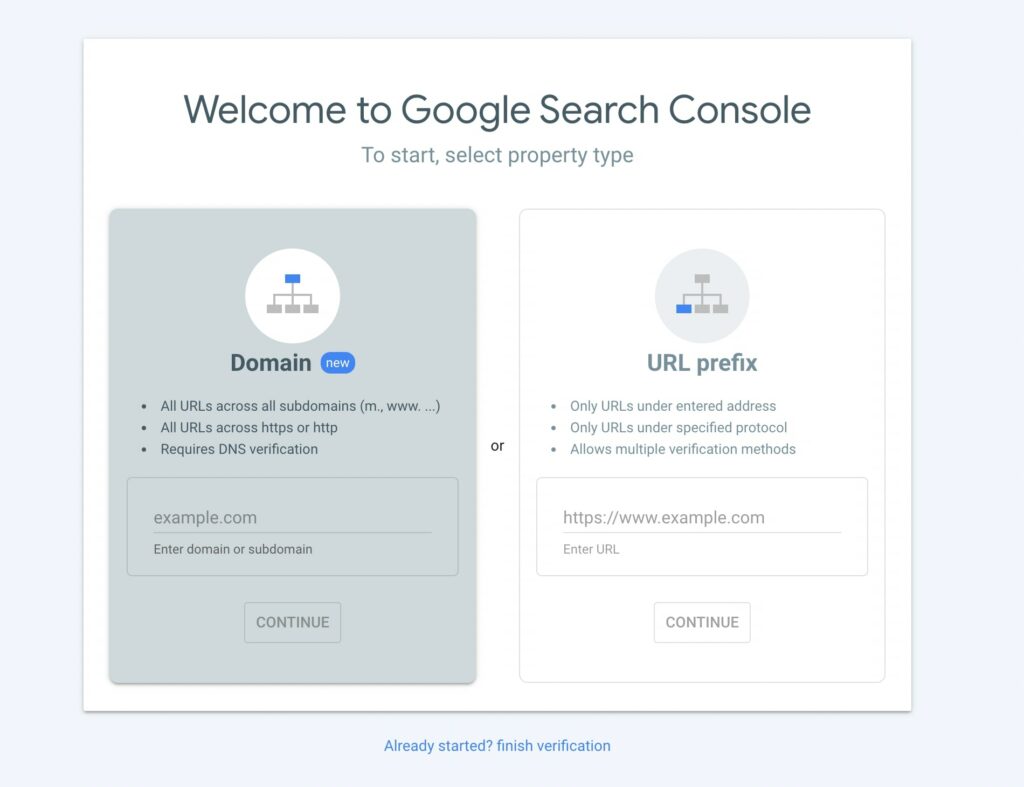
To start using this tool, you’ll need to select a property type. You can either enter your website’s domain or URL prefix. Depending on the option you choose, make sure you use the right format, as follows:
- Domain: example.com
- URL prefix: https://www.example.com
Keep in mind that if you enter a domain, you’ll need to verify your site ownership using DNS verification. With a URL prefix, you can use multiple forms of verification. After you’ve entered your website, select Continue.
Step 2: Verify Your Domain
Next up, it’s time to verify that you own your website. To do this, you can simply download the HTML file provided to you and upload it to your website. Remember, even after you finish the verification, you’ll need to keep this in your site files:
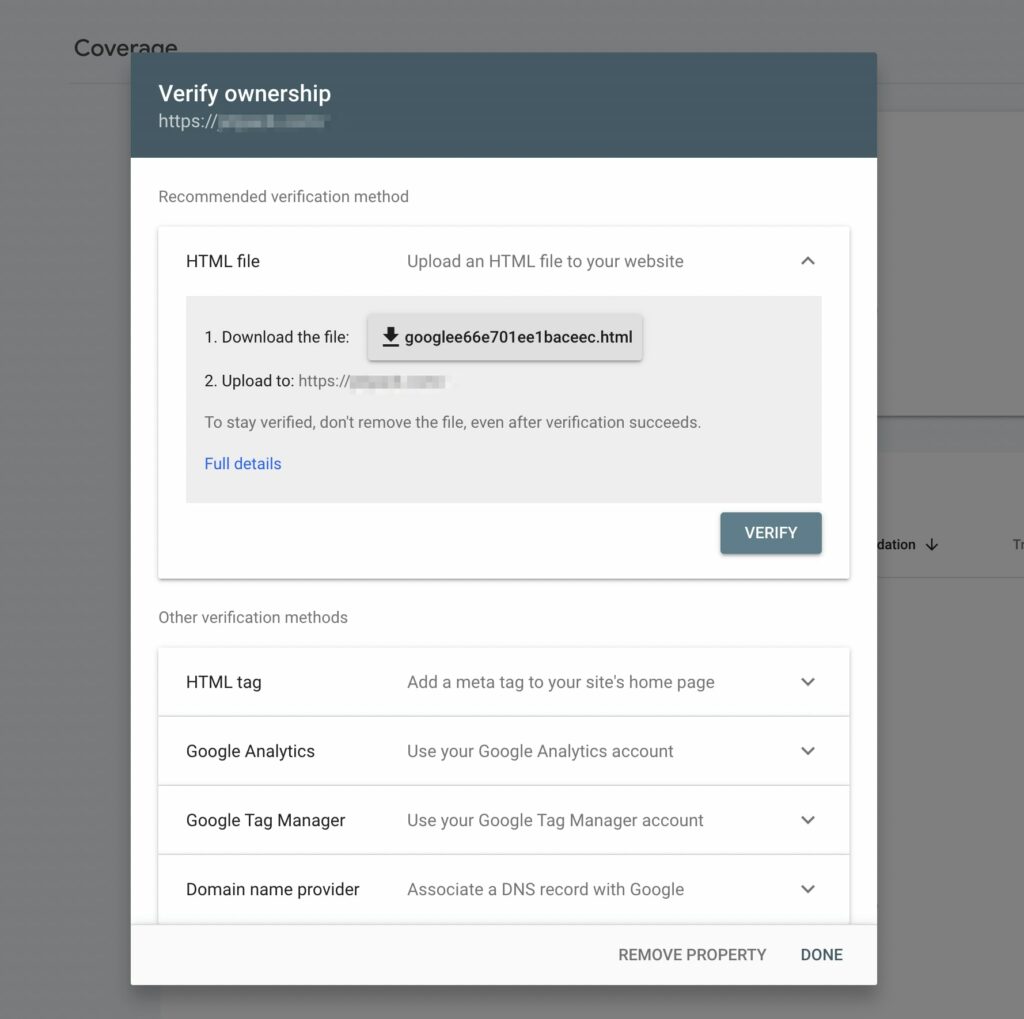
However, there are many other methods to verify site ownership. Here are some alternatives to uploading an HTML file:
- HTML tag: You can copy the given meta tag and paste it into the <head> section of your home page.
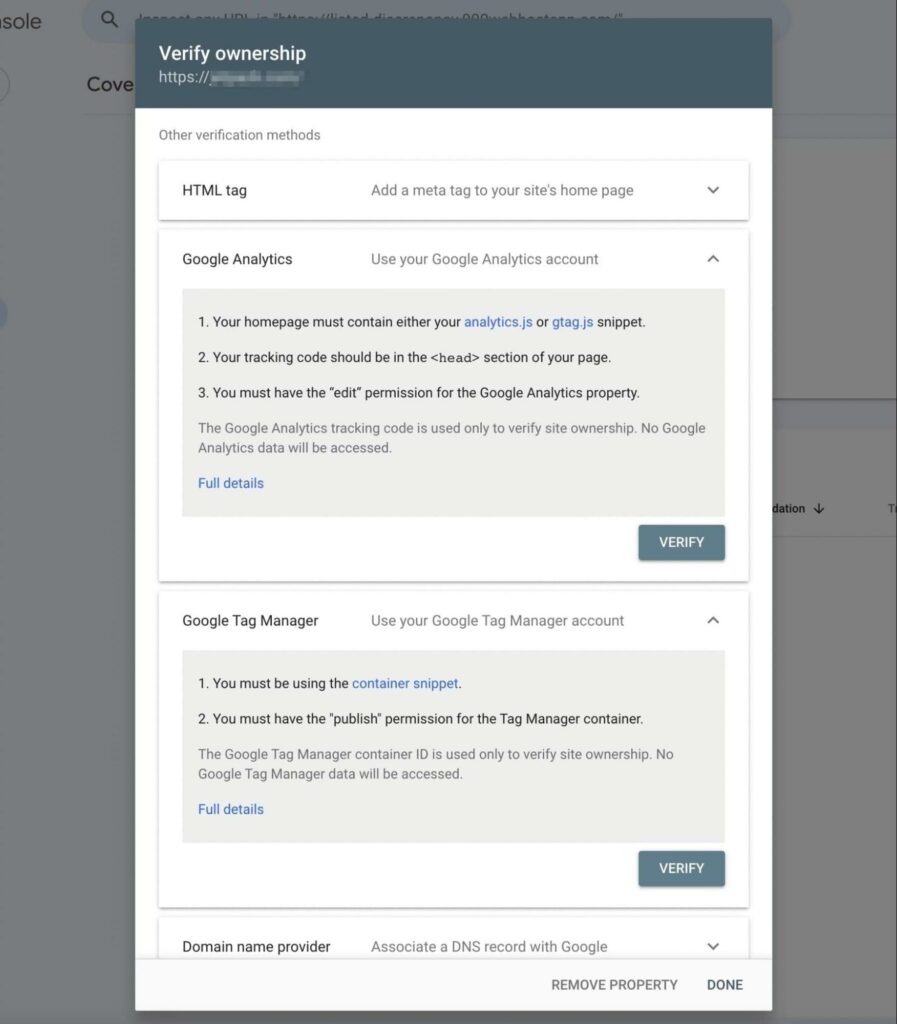
- Google Analytics: You can use your Google Analytics tracking code.
- Google Tag Manager: You can use your Google Tag Manager container ID.
- Domain name provider: You can sign into your domain name provider and paste the given TXT record into your DNS configuration.
Once you select a method, click on Verify in its section. This will allow Google to check whether you really own this website:
After Google Search Console verifies your site ownership, you should be able to access your performance and SEO analytics!
How to Use Google Search Console (7 Tips)
Once you sign up for Google Search Console and verify your site, you may become overwhelmed by the amount of analytics available. To make this process easier, we’ve compiled a list of the different ways you can use GSC to optimize your website!
1. View Performance Reports
One of the first features you’ll see in the new Google Search Console is the Performance tab. This replaced the Search Analytics report in the previous version of GSC. It contains much of the same data, except you can gain reports for longer periods:
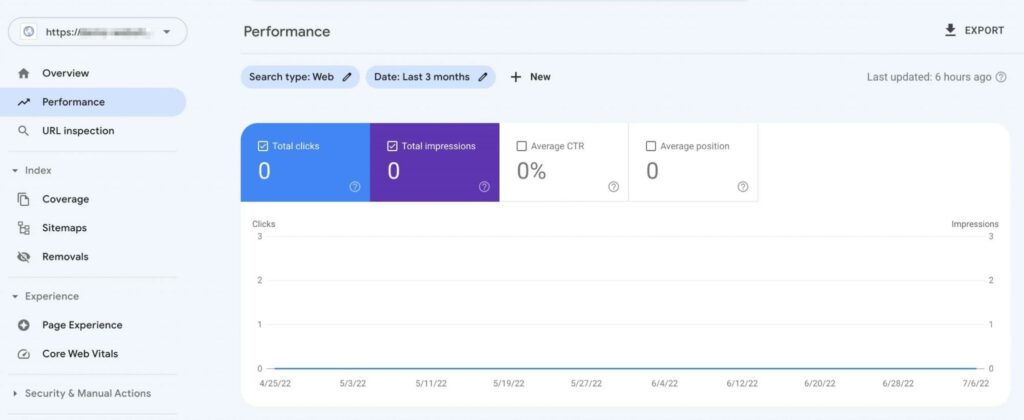
In the Performance report, there are four different metrics you can evaluate:
- Total Clicks: Records how many clicks your website received from a Google search result.
- Total Impressions: Totals how many of your links users saw on a search page. For an impression to count, your link must simply be one of the search results on a visitor’s page, but they don’t need to scroll or click on it.
- Average Click-Through Rate (CTR): Calculated by dividing the click count by the impression count.
- Average position: Records the average ranking position of your website’s topmost result. Meaning, if your keyword rank is at 2, 4, and 6, your average position would be 2.
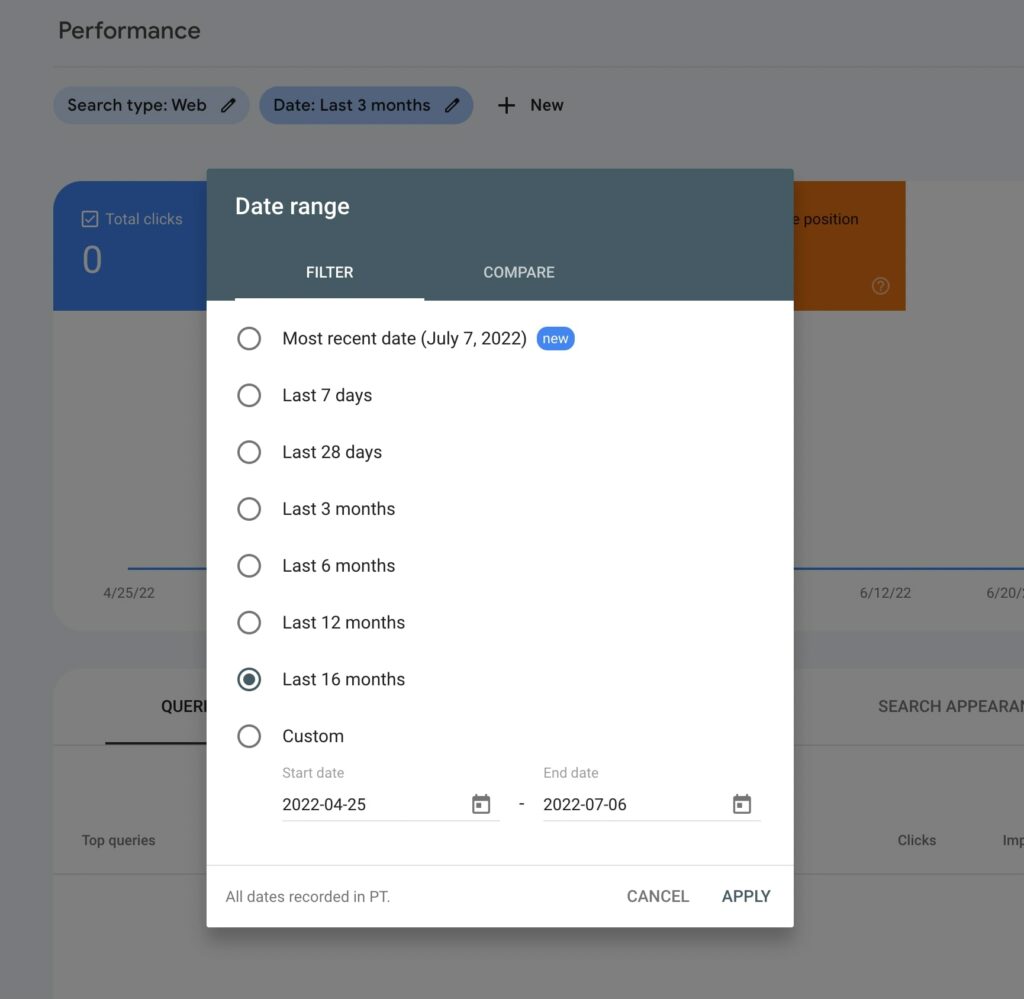
Plus, the new Google Search Console enables you to filter your results by time period. Using the Date filter, you can view your performance from up to the last 16 months or select a custom date range:
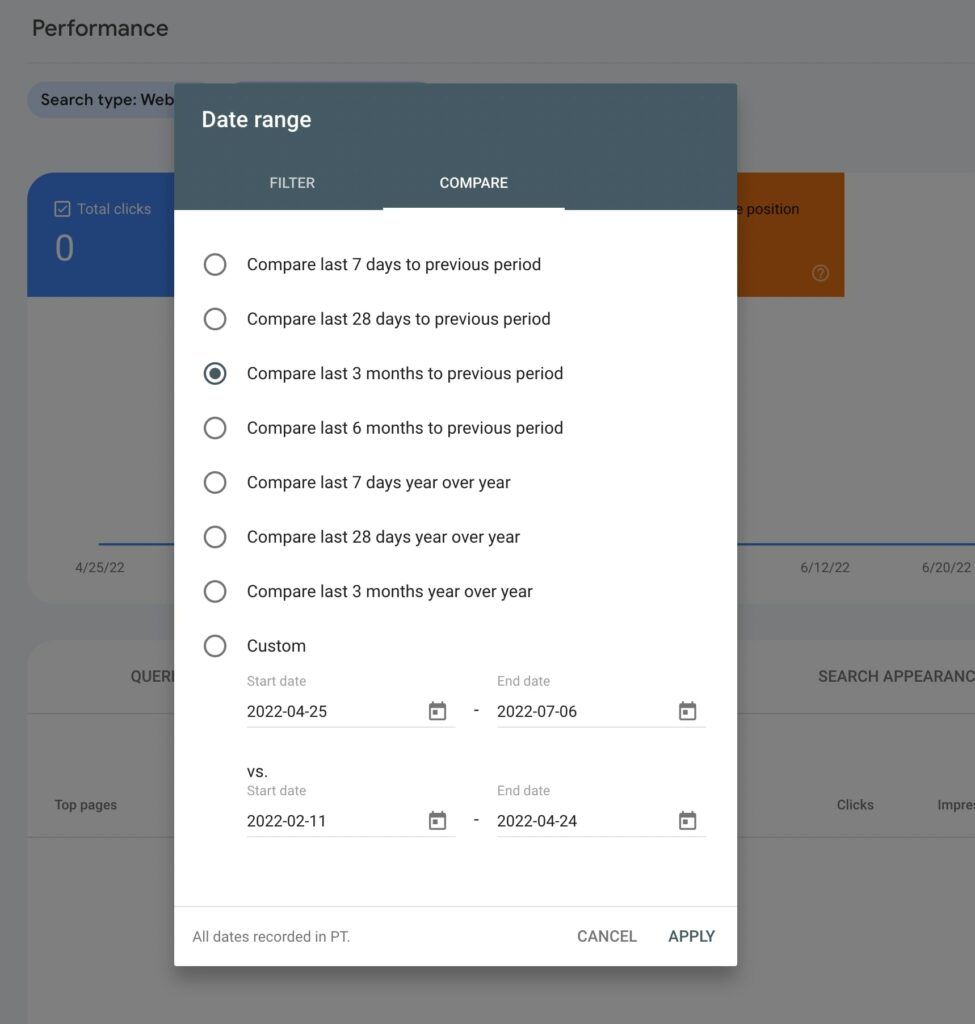
Alternatively, you can click on the Compare tab. Here, you can see how your performance has changed over time:
Using this Performance report, you can find your highest-performing pages. By navigating to the Pages section, you can see which pages get the most clicks and impressions. This can also tell you each page’s CTR and ranking position:
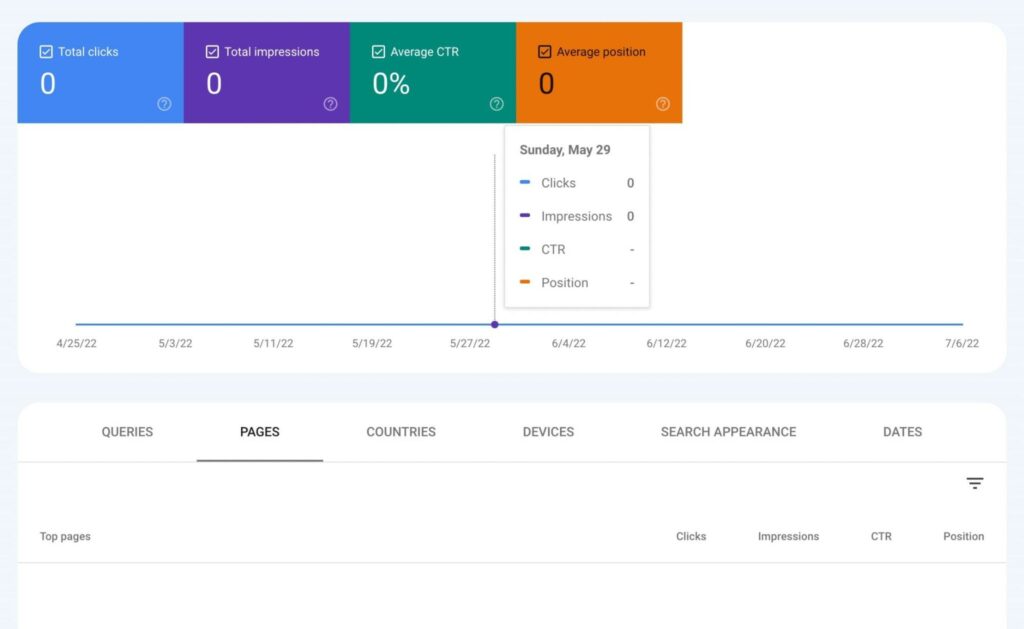
Google Search Console can also give you performance data about your traffic queries. Additionally, you’ll be able to see how well your site performs across different devices and countries.
2. Assess the Index Coverage Report
Although you could see performance reports with the old Google Search Console, there are new features that you can use to optimize your site. For example, the Index Coverage report replaced the Index Status and Crawl Errors sections, making it easier to understand how Google crawls your content:

Essentially, the Index Coverage report can inform you about any issues Google encountered when indexing your website. When you first open this page, you’ll see four different bar charts:
- Error (red): The page was not indexed due to an error.
- Valid with warnings (yellow): Google was able to index the page, but there is an issue you should fix.
- Valid (green): The page was successfully indexed.
- Excluded (gray): Pages were excluded from indexing, likely due to a noindex directive.
One of the most important areas to look at is the Errors tab. In Google Search Console, this may highlight 404 errors, server errors, or redirect errors. When you scroll down the page, you can view the specific details of each error so you know how to fix them.
Ideally, you should aim to increase the number of valid indexed pages by resolving these errors, as well as any warnings. However, it’s important to note that Google won’t index every URL on your website, just the canonical pages.
Furthermore, you can’t expect Google to index your content right away. After you add new content or fix an error, it can take a few days to complete the indexing. If you need to, you can request indexing to speed up the process.
3. Use the URL Inspection Tool
Another new feature in Google Search Console is the URL Inspection tool. This can give you information about the indexed version of a certain web page.
To inspect a URL, click on the URL inspection tab on the left-hand side of the dashboard. Alternatively, you can navigate to the search bar at the top of the page:

Then, you can search for a URL. Keep in mind that the link must be inside the current property, meaning the website you’re testing. You can also test AMP and non-AMP URLs.
Once you enter a URL from your website, you’ll receive information about the most recently indexed version of the page. At the top of the results, you can view whether your URL is on Google or not:

If it says your URL is on Google, this page is eligible to appear in search results. However, this isn’t a guarantee that it’s there. When you get a URL is not on Google result, this means the URL can’t appear in any searches.
Next, you can expand the Coverage section. Under Discovery, you can find out how Google discovered the URL. This will catalog any sitemaps or referring pages that led to this link:

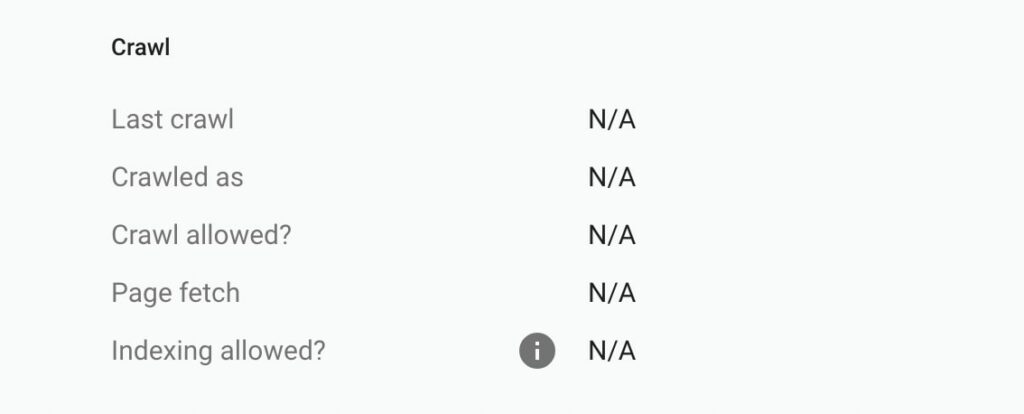
If Google was able to crawl this page, you can discover information about this process in the Crawl section. Here, you can view when it was crawled, as well as any errors that Google encountered:
You can also test a live URL by selecting Live Test. This will evaluate the URL in real-time, confirming that Google can access your page for indexing:
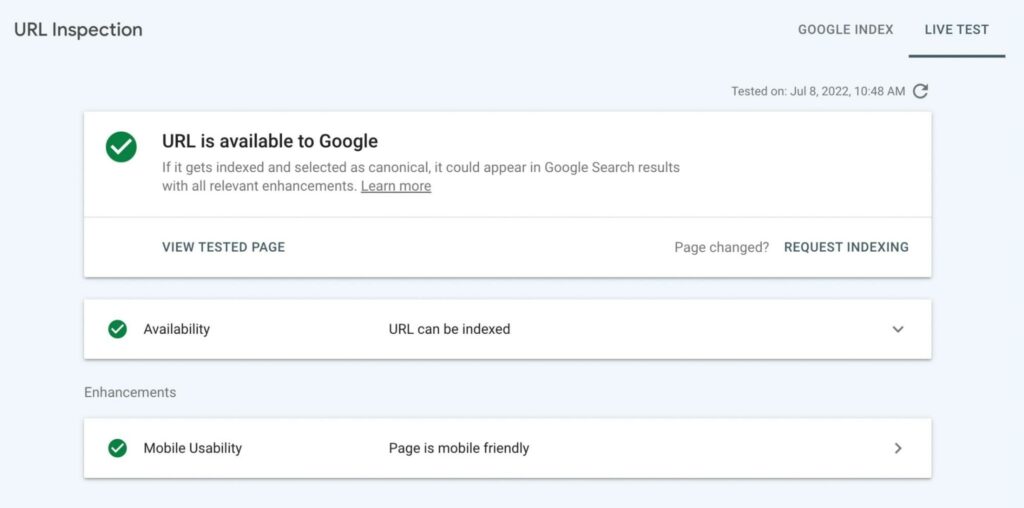
For valid URLs, you’ll see the canonical URL that Google selected for the page. If the page has structured data, you can also see data about mobile usability.
4. Check for Mobile Usability
As a website owner, it’s important to consider making your pages mobile-friendly. Since 85% of Americans own a smartphone, you’ll want to make sure that your website looks and performs well on mobile devices.
Plus, optimizing your content for mobile devices can actually improve your SEO. Due to a recent change in Google’s algorithm, it now considers mobile-friendliness to be a ranking factor.
Using the Mobile Usability report in Google Search Console, you can easily target any issues visitors experience on mobile devices. This chart labels each of your web pages as mobile-friendly or not:
For each page, you’ll see one of two statuses. If it says Error, the page is below the minimum usability level. A Valid status indicates a page is mobile-friendly.
In the Details section below, you can review the specific issues that cause mobile usability errors. Here are some errors that you may see:
- Uses incompatible plugins: This occurs when a page uses a plugin that isn’t supported by mobile browsers.
- Viewport not set: The viewport property informs browsers how to adjust your page dimension and scaling to fit screen sizes. Without it, the page may not resize correctly.
- Viewport not set to ‘device-width’: If the page has a fixed-width viewport property, the page can’t adjust to different screen sizes.
- Content wider than screen: The page requires mobile users to scroll horizontally to see all of its words and images.
The Mobile Usability report may also provide errors if your text is too small to read or if clickable elements are too close together. Any of these factors can lead to a poor user experience for mobile users.
After you fix these errors, you can ask Google to recrawl the adjusted pages. If Google confirms this, you can eliminate all your mobile usability issues. This can make your website more adaptable and responsive.
5. Evaluate Page Experience
You can also use Google Search Console to evaluate your site’s page experience. When you navigate to the Page Experience tab, you can see a summary of how your visitors experience your website.
This report considers the usability of each of your URLs. When it comes to user experience, you’ll be able to see which URLs are labeled Good, Poor, or Need Improvement.
To assess your page experience, GSC tests its Core Web Vitals. This considers your page’s speed, responsiveness, and stability. For your website to achieve a ‘Good’ rating overall, it needs to have a ‘Good’ result for Cumulative Layout Shift (CLS), Largest Contentful Paint (LCP), and First Input Delay (FID).
Along with having a ‘Good’ Core Web Vitals score, your page needs to have no issues in the Mobile Usability report. Finally, it should be served over HTTPS.
In this report, you can also see the total impressions from your good URLs. Additionally, it will show the percentage of URLs that have a ‘Good’ rating each day.
If you’re new to Google Search Console, you may not have enough usage data. In this case, you’ll have to wait a few days to receive your page experience evaluation:
After you first gain access to the Page Experience report, you may be disappointed with your results. However, there are many ways to improve your page experience.
Since this Page Experience report is based on your Core Web Vitals, you can take steps to improve these metrics. By implementing caching or a Content Delivery Network (CDN), you can reduce loading times and allow visitors to easily access your content.
6. Add an XML Sitemap
To put it simply, an XML sitemap is a file that tells Google which web pages are the most important. When you create one for your website, this can help search engines determine which content to crawl. By prioritizing certain pages, you can prevent Google from crawling unnecessary pages.
Luckily, Google Search Console makes it easy to submit a sitemap. It can even check your added sitemap for any errors. However, first you’ll need to know how to create one.
In WordPress, you can use a plugin like Yoast SEO to build your first sitemap. First, install and activate the plugin. Then, go to Yoast SEO > General > Features:
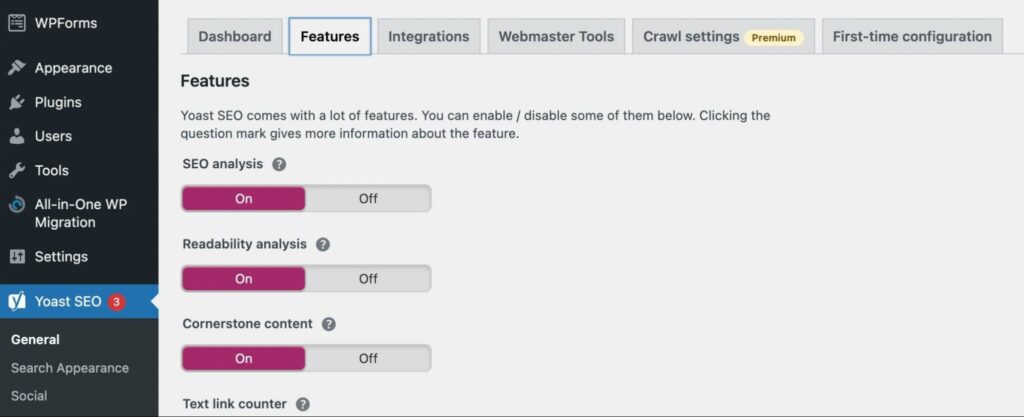
Scroll down to the XML sitemaps setting. Make sure that this is turned on, then save your changes:

This will automatically generate an XML sitemap for your website. To view this, click on the question mark icon and select See the XML sitemap:

This will generate your XML sitemap on a new page. You can review this information, then copy its link:
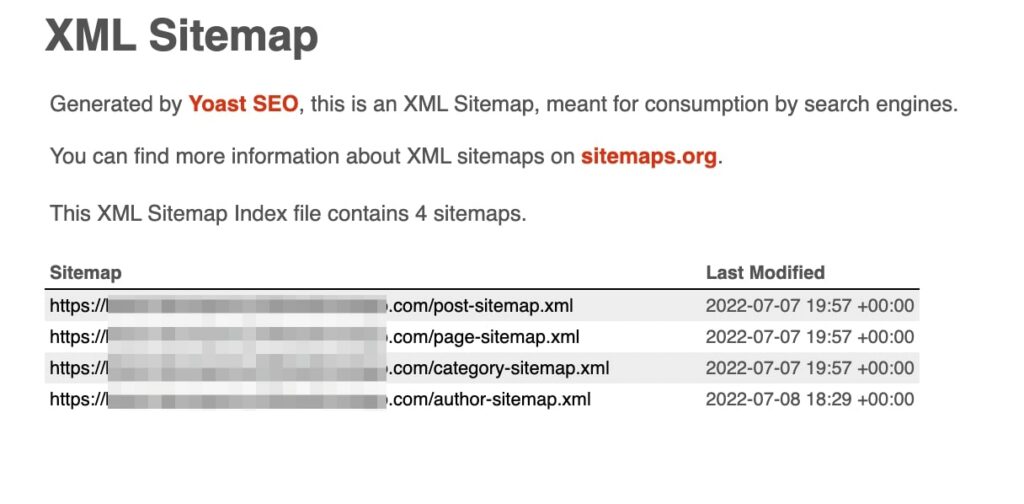
Now you can go back to Google Search Console and find the Sitemaps tab. Under Add a new sitemap, enter the URL:
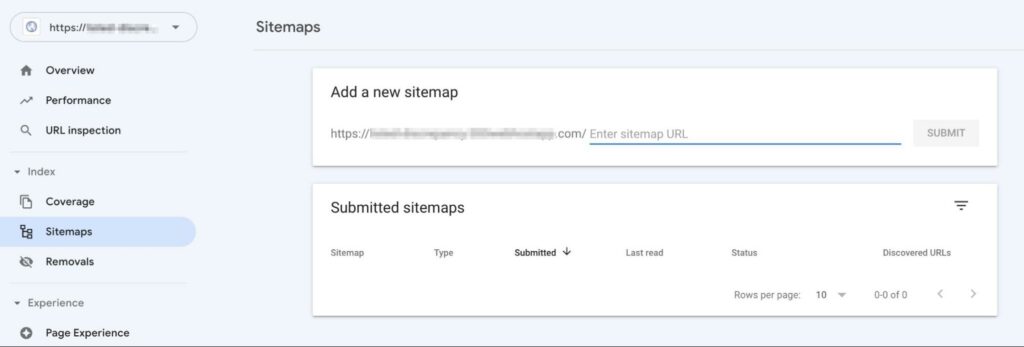
After you add the sitemap, it’ll appear under Submitted sitemaps. You’ll be able to see the status of the latest crawl. Possible values include: Success, Has errors, and Couldn’t fetch:

In this section, you can also check the last time Google fetched your sitemap. Additionally, Google Search Console will tell you the number of URLs that were found in the sitemap.
7. Utilize the Links Report
Often, an effective way to improve your SEO is by generating backlinks from other websites. When you can get other sites to link to your content as a credible resource, you can increase your search ranking.
With Google Search Console, the Links report makes it easy to see which of your pages other sites link to. By clicking on the Links tab, you’ll be able to view your top-linked pages. This can help you recognize your most popular content:
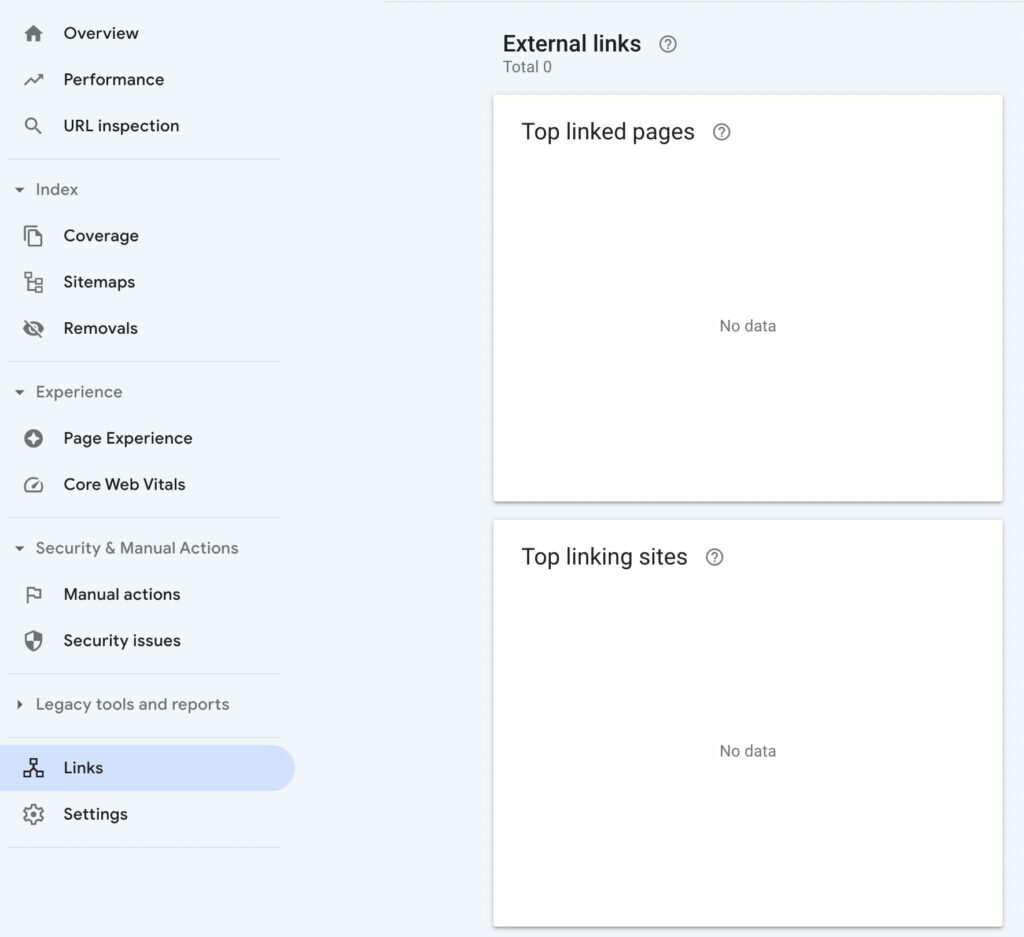
In the Top linking sites section, you can view which external websites are linking to your pages the most. This can enable you to notice other sites in your niche. Additionally, if you discover any spam sites, you can ask Google to remove them.
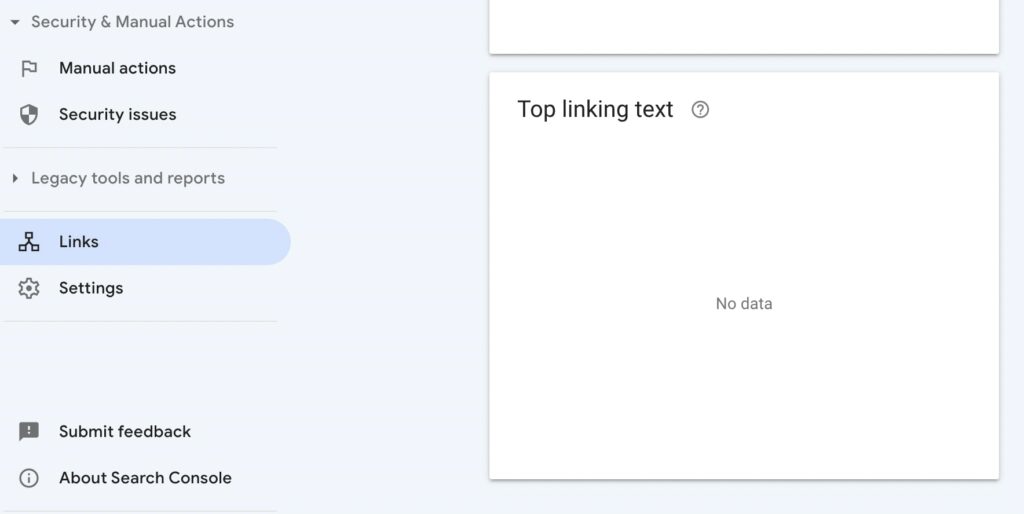
Google Search Console will also point out which link text is used to direct users to your website. Using this information, you can evaluate the way that other sites describe your content:
The Links report can also be used to review your internal links. You can see which pages you frequently link to throughout your content:
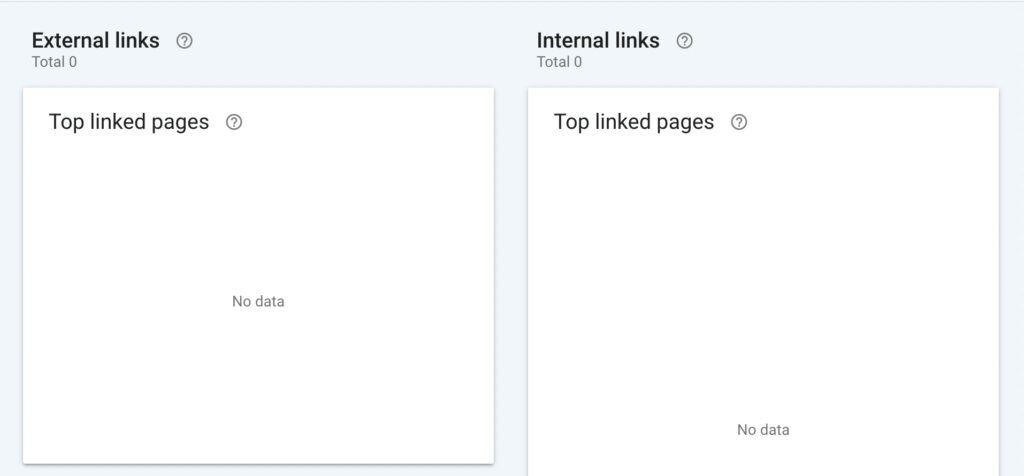
This can help you identify broken links on your website. Plus, if you’re not properly linking to core pages like your home or contact page, you can make adjustments accordingly.
Simplify Your SEO with Google Search Console
When you’re trying to master SEO, it can be frustrating to find the right tools. Although you could use a plugin, it might not have all the performance metrics you need. Fortunately, Google Search Console provides a free collection of services that enable you to optimize SEO all in one place.
Optimizing your website for Search is an important part of growing your online audience. However, you might not have the time to manage performance reports and solve issues. With DreamHost Pro’s SEO services, you can let the professionals configure and manage Google Search Console for you!
Search Engine Optimization Made Easy
We take the guesswork (and actual work) out of growing your website traffic with SEO.

The post Google Search Console: Complete Overview & New Features appeared first on Website Guides, Tips & Knowledge.
source https://www.dreamhost.com/blog/google-search-console/
No comments:
Post a Comment